CDM insights - intelligence about the CDM at the end of each month
| Data as of: 31 December 2012 |
|---|
Number of CDM project activities that have issued CERs: |
| ♦Potential supply of: | |||
|---|---|---|---|---|---|
| ♣CERs to the end of the 1st KP commitment period (31 Dec. 2012) | CERs to the end of 2015 | CERs to the end of 2020 | CERs to the end of all current crediting periods | ||
| ♠1986 | 1,154,664,328
|
1,755,899,520
|
2,676,208,896
|
3,107,529,728
|
3,113,080,320
|
♠Adjusted by past rate of issuance |
1,405,740,288
|
2,094,624,128
|
2,389,277,952
|
2,392,689,664
|
|
Number of CDM project activities: | ♦Potential supply of: | |||
|---|---|---|---|---|
| ♣CERs to the end of the 1st KP commitment period (31 Dec. 2012) | CERs to the end of 2015 | CERs to the end of 2020 | CERs to the end of all current crediting periods | |
| 7510 , of which: | 2,216,171,008
|
4,760,302,080
|
7,619,723,264
|
8,071,658,496
|
|
2,191,882,240
|
4,089,997,568
|
5,703,236,608
|
5,833,046,016
|
|
4,604,896
|
137,067,328
|
369,327,488
|
407,627,584
|
|
17,546,528
|
514,484,128
|
1,502,483,456
|
1,781,894,912
|
|
1,304,460
|
17,387,650
|
42,899,808
|
47,313,816
|
|
832,766
|
1,365,367
|
1,775,850
|
1,775,850
|
Notes:
♥ CERs issued include tCERs.
♦ The potential supply of CERs excludes CERs from projects undergoing validation, rejected or withdrawn and is based on average annual CERs such that all activities simultaneously deliver their expected annual average emission reductions equally across all years of all their respective crediting periods. Only CERs from projects for which the renewal of the crediting period has been approved are included.
♠ The past rate of issuance is the ratio of CERs issued over the expected CERs to be issued up to the date of the last issuance, capped to 1.
♣ CERs to the end of 1st. KP commitment period (31 Dec. 2012) include CERs potentially issued after 31 December 2012 for emission reductions that occurred prior to 31 December 2012.
| Validation | Title | Description | Unit | Data |
|---|---|---|---|---|

|
 Projects entering validation Projects entering validation |
Number of projects that have successfully started validation per month, showing both large and small scale projects and overall trend | Projects/month |  |

|
 Trend of projects entering validation by host party Trend of projects entering validation by host party |
Trend over time of projects in countries (Host Parties), which have the most validation projects per month | Projects/month |  |

|
 Trend of types of projects entering validation Trend of types of projects entering validation |
Trend over time of types of projects (UNEP Risoe), which have the most validation projects per month | Projects/month |  |
| Registration | Title | Description | Unit | Data |
|---|---|---|---|---|

|
 Projects registered and registering Projects registered and registering |
Number of projects that have successfully started registration or are registered per month, showing both large and small scale projects and overall trend. | Projects/month |  |
|
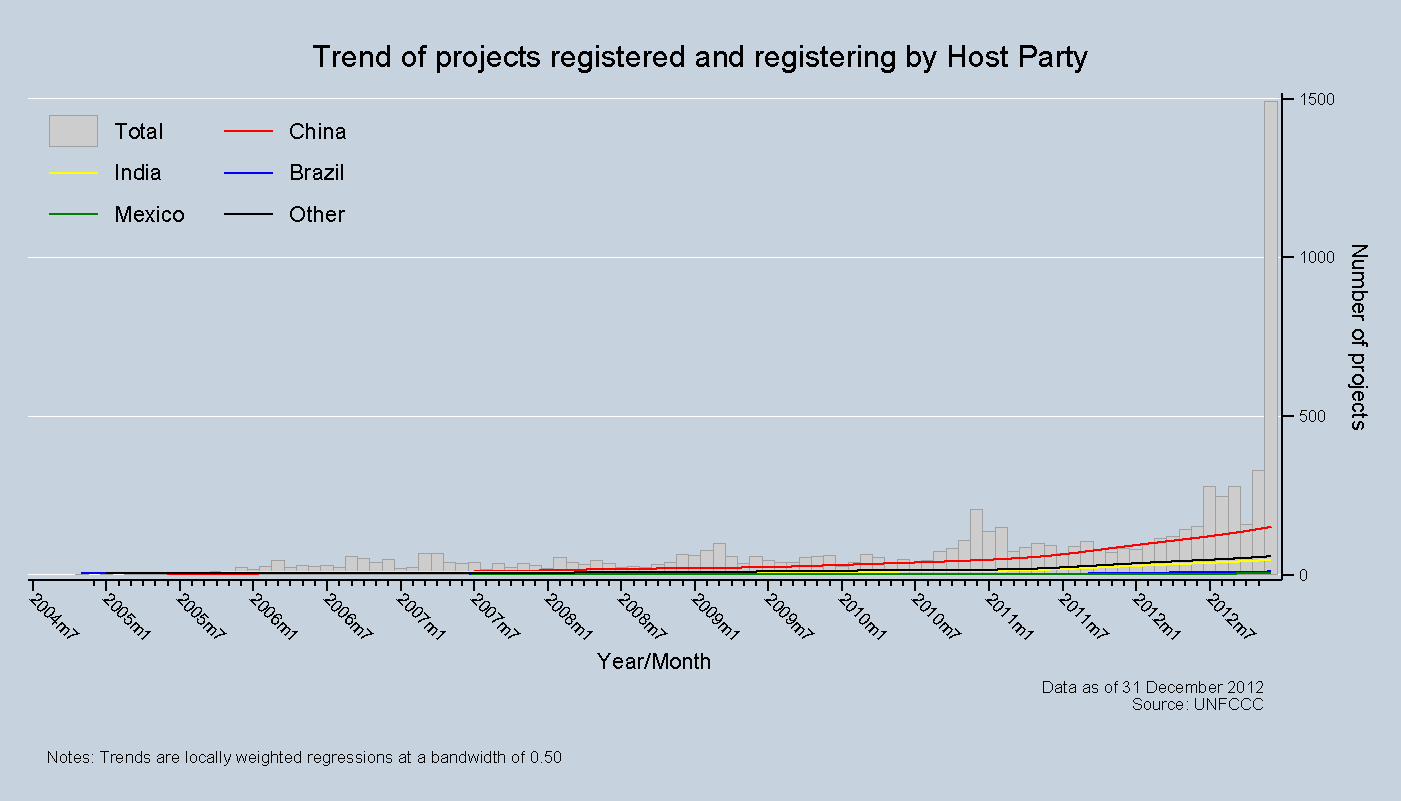
 Trend of projects registered and registering by Host Party Trend of projects registered and registering by Host Party |
Trend over time of projects in countries (Host Parties), which have the most registered and undergoing registration projects per month. | Projects/month |  |

|
 Trend of types of projects registered and registering Trend of types of projects registered and registering |
Trend over time of types of projects (UNEP Risoe defined), which have the most registered and undergoing registration projects per month | Projects/month |  |

|
 Distribution of registered projects by Host Party Distribution of registered projects by Host Party |
Percentage of projects by Host Party of all registered projects | % Projects/Host Party |  |

|
 Distribution of registered projects by Other Party Distribution of registered projects by Other Party |
Percentage of projects by Other Party of all registered projects | % Projects/Other Parties |  |

|
 Distribution of registered projects by UNFCCC region Distribution of registered projects by UNFCCC region |
Percentage of projects belonging to a UNFCCC defined region of all registered projects | % Projects/Region |  |
|
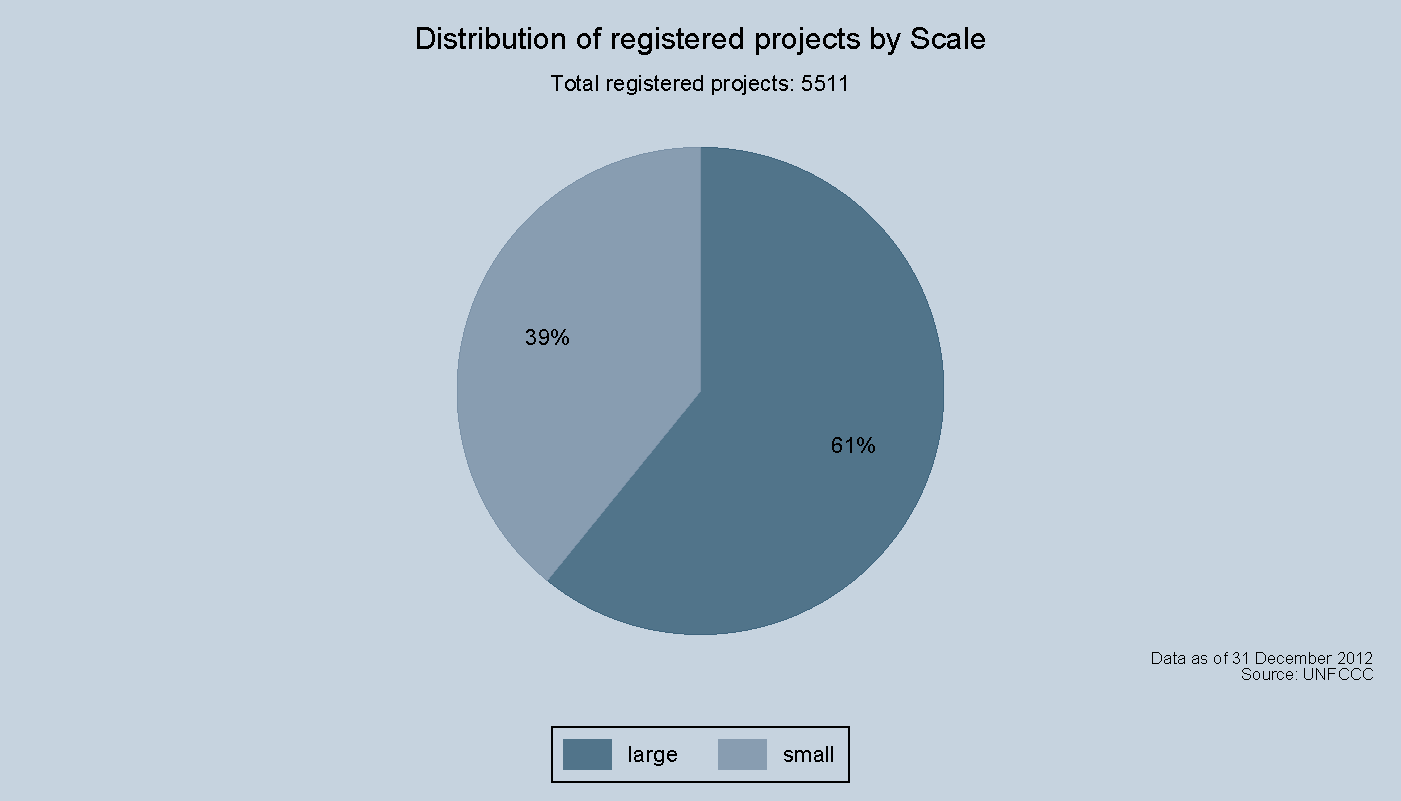
 Distribution of registered projects by Scale Distribution of registered projects by Scale |
Percentage of projects belonging to a CDM scale of all registered projects. | % Projects/Scale |  |

|
 Distribution of registered projects by Scope Distribution of registered projects by Scope |
Percentage of projects belonging to a CDM scope of all registered projects | % Projects/Scope |  |
| Issuance | Title | Description | Unit | Data |
|---|---|---|---|---|

|
 Distribution of expected CERs from registered projects by Host Party Distribution of expected CERs from registered projects by Host Party |
Percentage (of the total) expected CERs from registered projects in a Host Party. Total CERs are based on each project`s average annual expected CERs | % CERs/Host Party |  |

|
 Distribution of CERs issued by Host Party Distribution of CERs issued by Host Party |
Percentage CERs issued from registered projects in a Host Party | % CERs/Host Party |  |
|
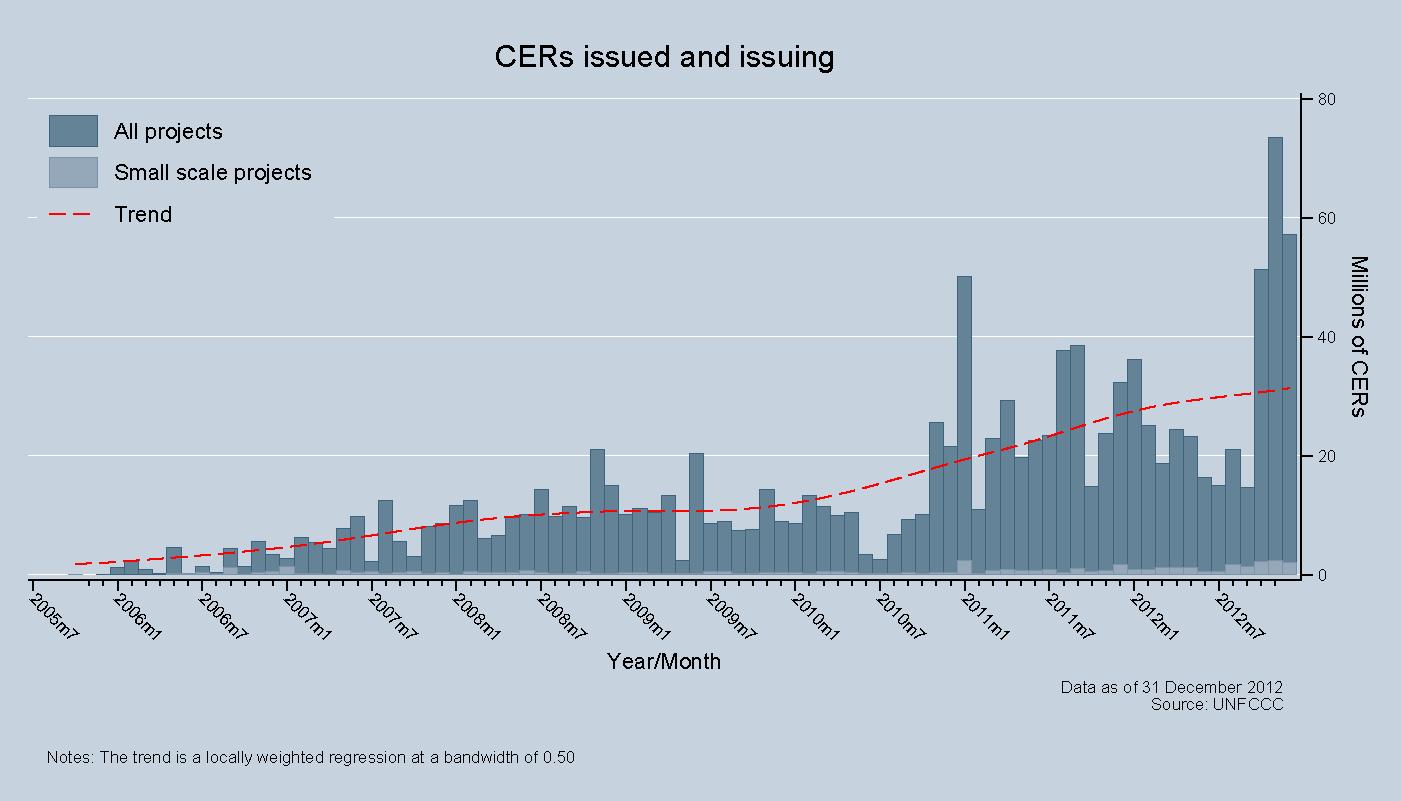
 CERs issued and issuing CERs issued and issuing |
Number of CERs issued and issuing per month, showing both large and small scale CERs and overall trend | Million CERs/month |  |

|
 Trend of CERs issued and issuing by Host Party Trend of CERs issued and issuing by Host Party |
Trend over time of CERs issued and issuing in countries (Host Parties), which have the most CERs per month | Million CERs/month |  |

|
 Trend of types of CERs issued and issuing Trend of types of CERs issued and issuing |
Trend over time of types (UNEP Risoe defined) of CERs issued and issuing, which have the most CERs per month | Million CERs/month |  |
|
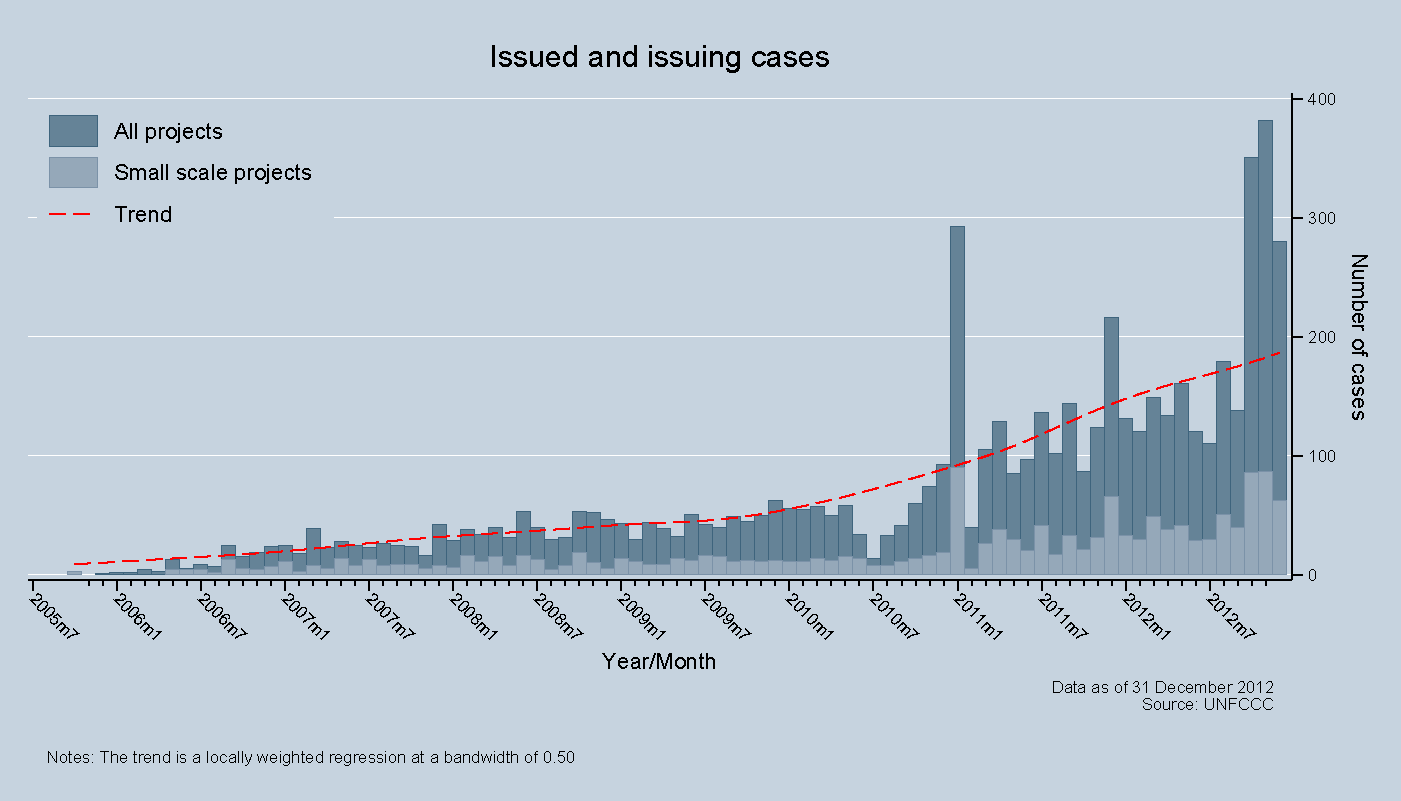
 Issued and issuing cases Issued and issuing cases |
Number of issuance and issuing request for issuance of CERs cases per month, showing both large and small scale CERs and overall trend | Cases/month |  |

|
 Trend of issued and issuing cases by Host Party Trend of issued and issuing cases by Host Party |
Trend over time of cases issued and issuing in countries (Host Parties), which have the most CERs per month | Cases/month |  |

|
 Trend of types of issued and issuing cases Trend of types of issued and issuing cases |
Trend over time of types (UNEP Risoe defined) of issued and issuing cases, which have the most CERs per month | Cases/month |  |
| First issuance | Title | Description | Unit | Data |
|---|---|---|---|---|

|
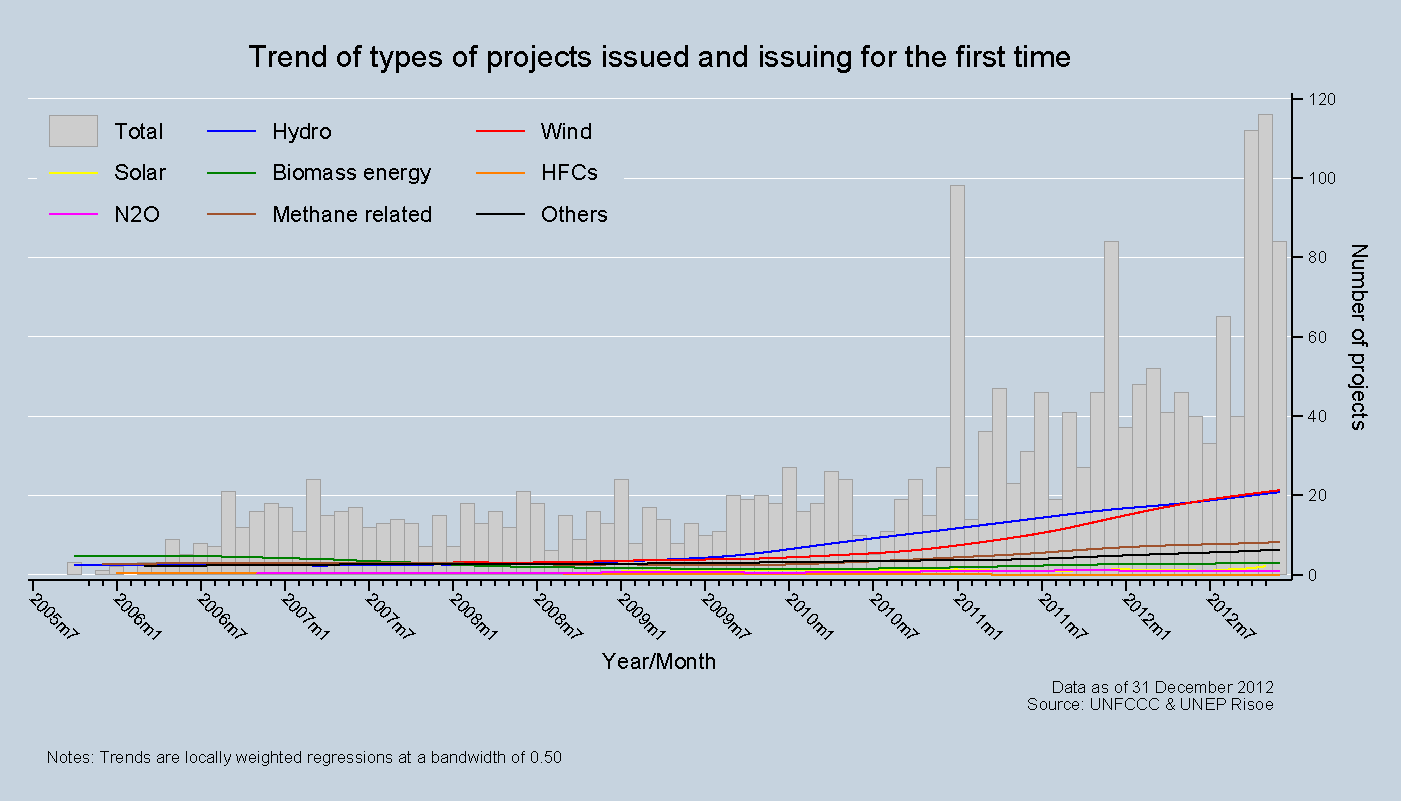
 Projects issued and issuing for the first time Projects issued and issuing for the first time |
Number of projects issued and issuing for the first time per month, showing both large and small scale projects and overall trend | Projects/month |  |

|
 Trend of projects issued and issuing for the first time by Host Party Trend of projects issued and issuing for the first time by Host Party |
Trend over time of projects issued and issuing for the first time in countries (Host Parties), which have the most CERs per month | Projects/month |  |
|
 Trend of types of projects issued and issuing for the first time Trend of types of projects issued and issuing for the first time |
Trend over time of types (UNEP Risoe defined) of projects issued and issuing for the first time, which have the most CERs per month | Projects/month |  |

|
 Trend of CERs issued and issuing for the first time by Host Party Trend of CERs issued and issuing for the first time by Host Party |
Trend over time of CERs issued and issuing from projects issued and issuing for the first time in countries (Host Parties), which have the most CERs per month | Million CERs/month |  |
| Methodologies | Title | Description | Unit | Data |
|---|---|---|---|---|

|
 Approved methodologies by Scope Approved methodologies by Scope |
Percentage of approved methodologies belonging to a CDM scope of all methodologies, showing both large, small scale and consolidated methodologies | Methodologies |  |
| DNA | Title | Unit | Data | |
|---|---|---|---|---|
|
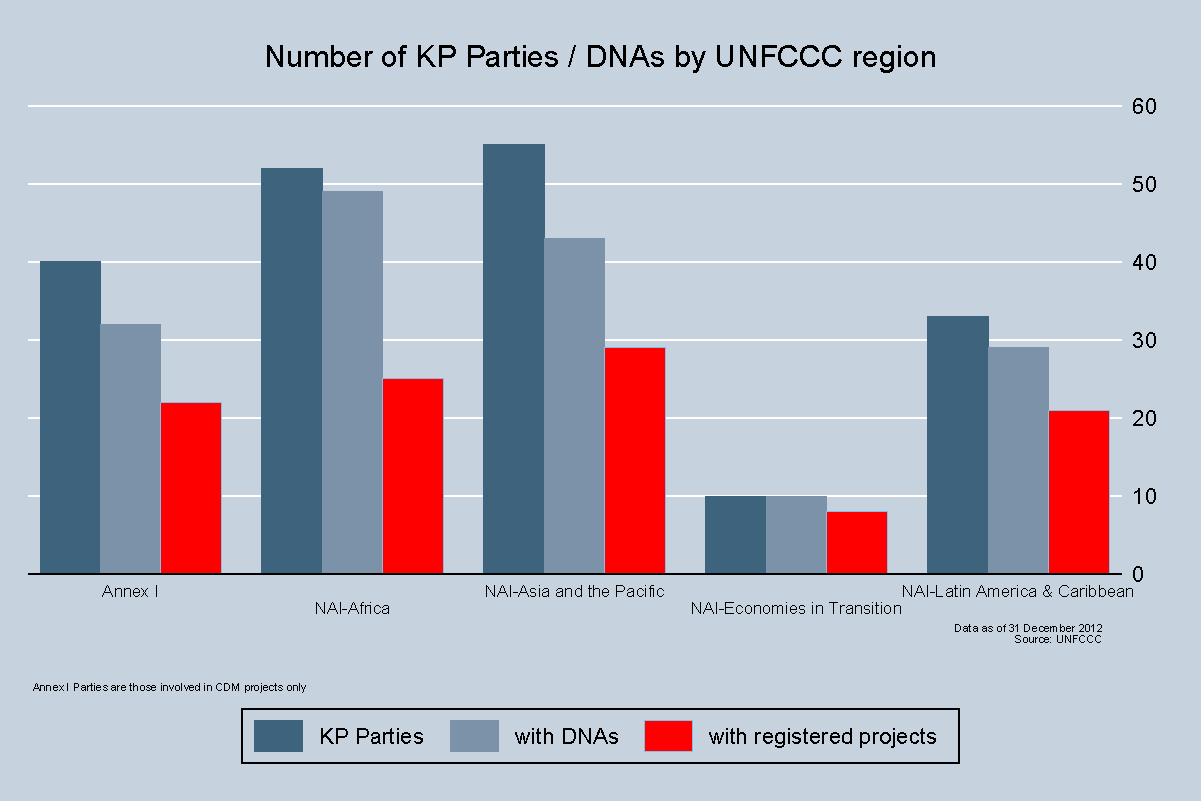
 Percentage of DNAs by UNFCCC region Percentage of DNAs by UNFCCC region |
Percentage of DNAs by UNFCCC region | DNAs |  |
|
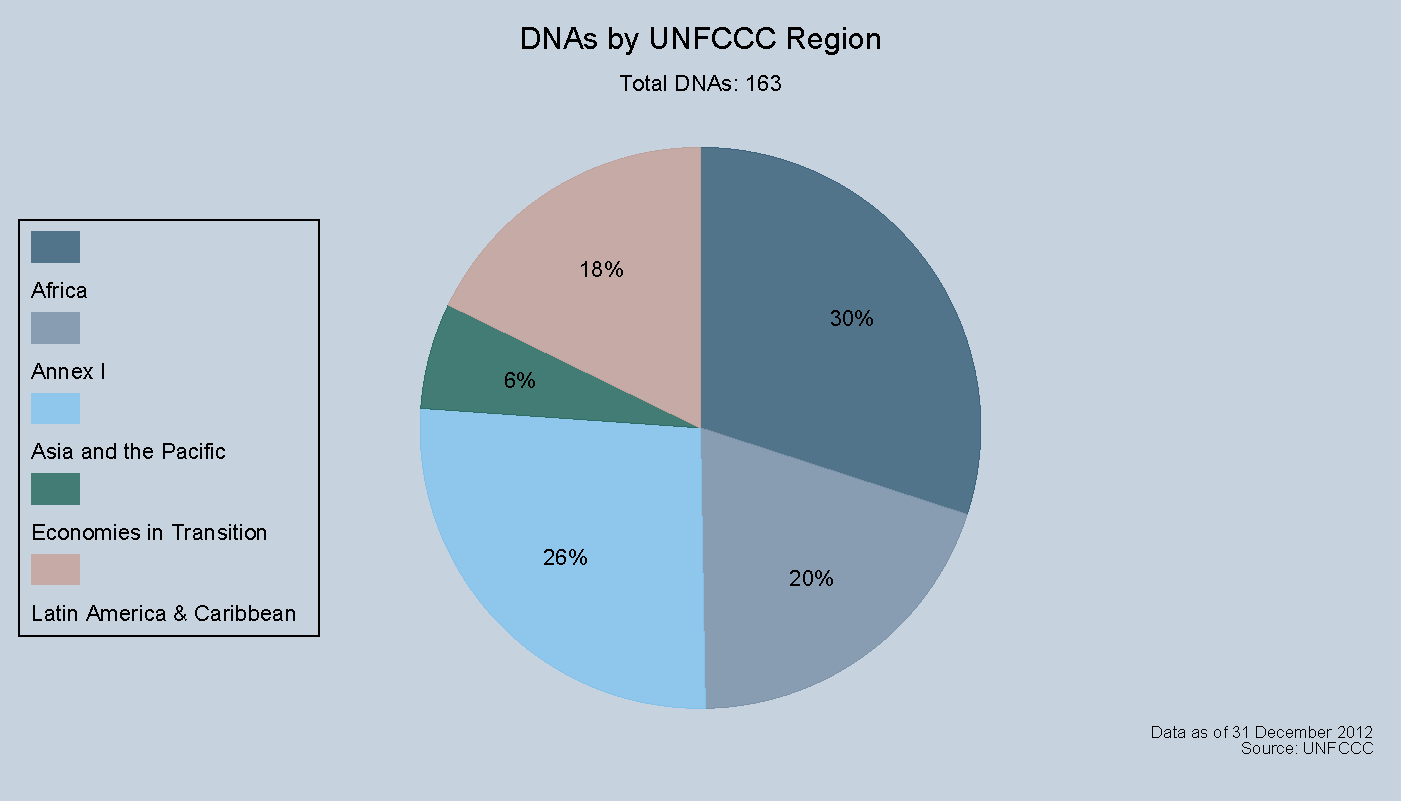
 Number of KP Parties and DNAs by UNFCCC region Number of KP Parties and DNAs by UNFCCC region |
Number of Parties that have ratified the Kyoto Protocol and number of Designated National Authorities by UNFCCC region, showing those Parties with registered projects | Parties andDNAs |  |
Total potential supply of CERs

 Total potential supply of CERs from the end of the 1st Kyoto Protocol commitment period (31 Dec. 2012) to 2020.

Map of KP Parties and DNAs

A geographic representation of Parties that have ratified the Kyoto Protocol and Designated National Authorities, showing those Host Parties that have less than 10 registered projects
Academics and Researchers
The UNFCCC secretariat collates time bound data on various aspects of the CDM, subject to availability. Universities and research institutes that need access to additional data for research purposes can send an email request to cdm-info@unfccc.int clearly stating the intended use of the data in a short research brief.


Offset now: visit the United Nations Carbon Offset Platform
Connect with us: