Project activities
|
Data as of: 31 Dec 2023 |
|---|
|
Number of CDM project activities that have issued CERs:
|
(KP1) |
♦Potential supply of:
| ||
|---|---|---|---|---|
| ♣CERs to the end of the 1st KP commitment period (31 Dec. 2012) |
CERs to the end of 2023
(Initial potential)
|
CERs to the end of all current crediting periods
| ||
| ♠3,617 |
2,361,843,696
(1,488,104,759)
|
1,485,517,425 | 5,595,380,485 | 5,875,236,586 |
|
♠Adjusted by past rate of issuance
|
2,361,843,712 | 2,479,972,608 | ||
Number of CDM project activities:
|
♦Potential supply of:
| ||
|---|---|---|---|
| ♣CERs to the end of the 1st KP commitment period (31 Dec. 2012) |
CERs to the end of 2023
(Initial potential)
|
CERs to the end of all current
crediting periods
(Initial potential)
| |
| 8,065 of which: | 1,623,027,064 | 9,056,611,953 | 9,594,110,246 |
| 7,842 are registered | 1,618,926,403 | 8,723,431,395 | 9,210,502,772 |
| 172 are pending publication | 1,303,710 | 281,593,742 | 318,998,527 |
| 51 are corrections requested | 2,796,950 | 51,586,815 | 64,608,946 |
| 0 are requesting registration | 0 | 0 | 0 |
| 0 are review requested |
0
|
0 | 0 |
Notes:
♥ CERs issued include tCERs and lCERs.
♦ The potential supply of CERs excludes CERs from projects undergoing validation, rejected or withdrawn and is based on average annual CERs such that all activities simultaneously deliver their expected annual average emission reductions equally across all years of all their respective crediting periods. Only CERs from projects for which the renewal of the crediting period has been approved are included.
♠ The past rate of issuance is the ratio of CERs issued over the expected CERs to be issued up to the date of the last issuance, capped to 1.
♣ CERs to the end of 1st. KP commitment period (31 Dec. 2012) include CERs potentially issued after 31 December 2012 for emission reductions that occurred prior to 31 December 2012.
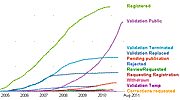
| Validation | Title | Description | Unit | Data |
|---|---|---|---|---|

|
 Projects entering validation Projects entering validation |
Number of projects that have successfully started validation per month, showing both large and small scale projects and overall trend | Projects/month |  |
| [CDM-V1:Openval] | ||||
|
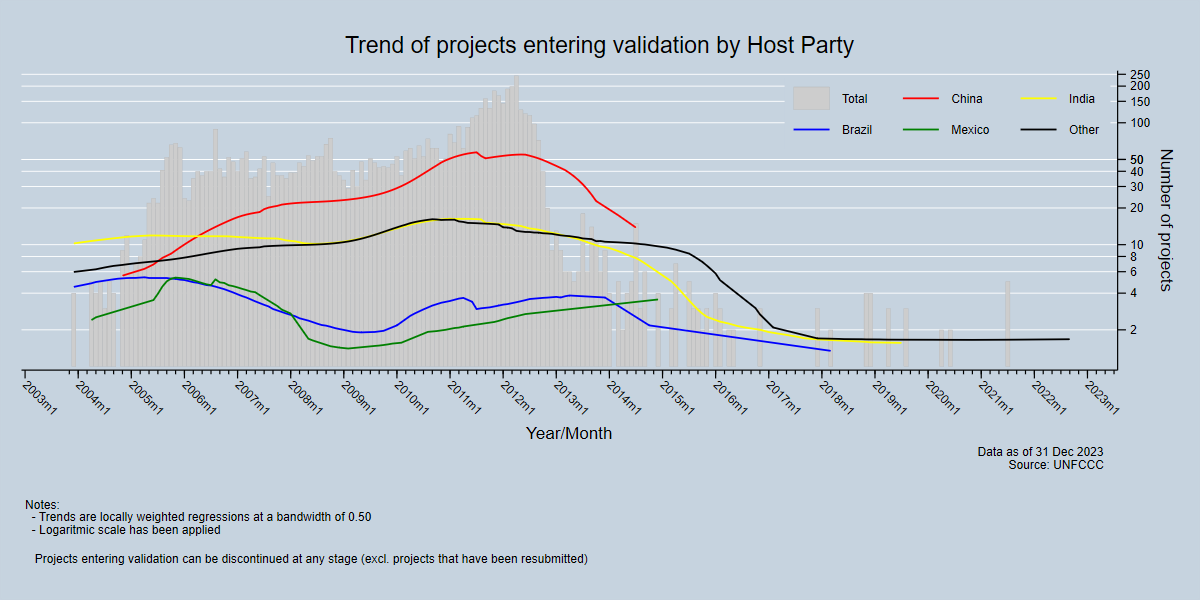
 Trend of projects entering validation by host party Trend of projects entering validation by host party |
Trend over time of projects in countries (Host Parties), which have the most validation projects per month | Projects/month |  |
| [CDM-V2:Openval] | ||||
|
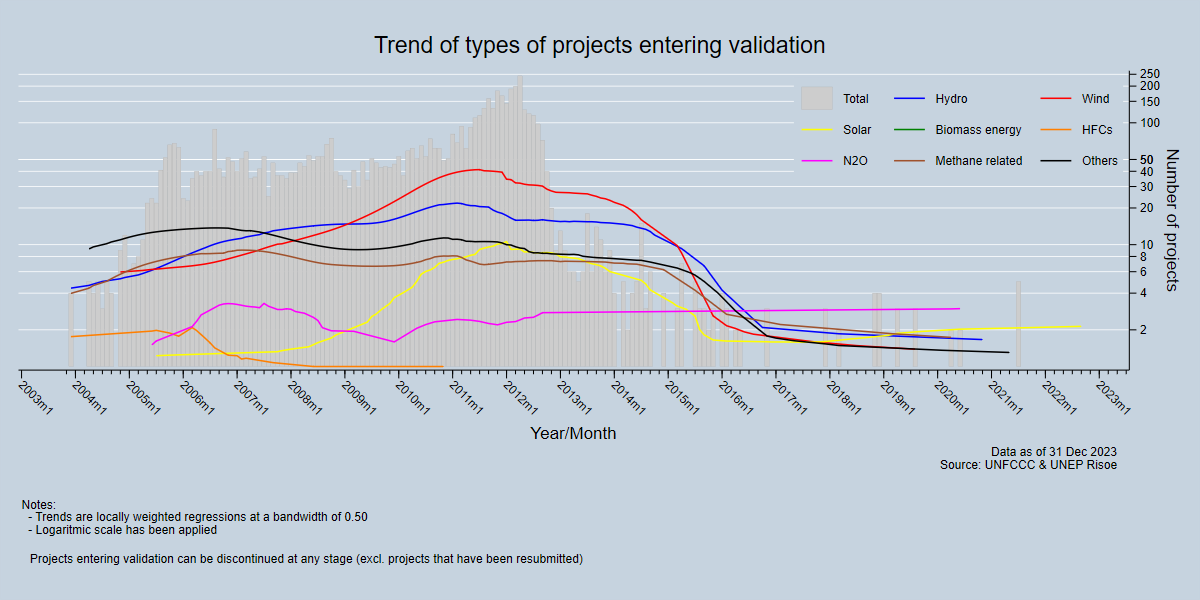
 Trend of types of projects entering validation Trend of types of projects entering validation |
Trend over time of types of projects (UNEP Risoe), which have the most validation projects per month | Projects/month |  |
| [CDM-V3:Openval] |
| Registration | Title | Description | Unit | Data |
|---|---|---|---|---|

|
 Projects registered and registering Projects registered and registering |
Number of projects that have successfully started registration or are registered per month, showing both large and small scale projects and overall trend. | Projects/month |  |
| [CDM-R1:Finalized Date / Registering Date] | ||||

|
 Trend of projects registered and registering by Host Party Trend of projects registered and registering by Host Party |
Trend over time of projects in countries (Host Parties), which have the most registered and undergoing registration projects per month. | Projects/month |  |
| [CDM-R2:Finalized Date / Registering Date] | ||||
|
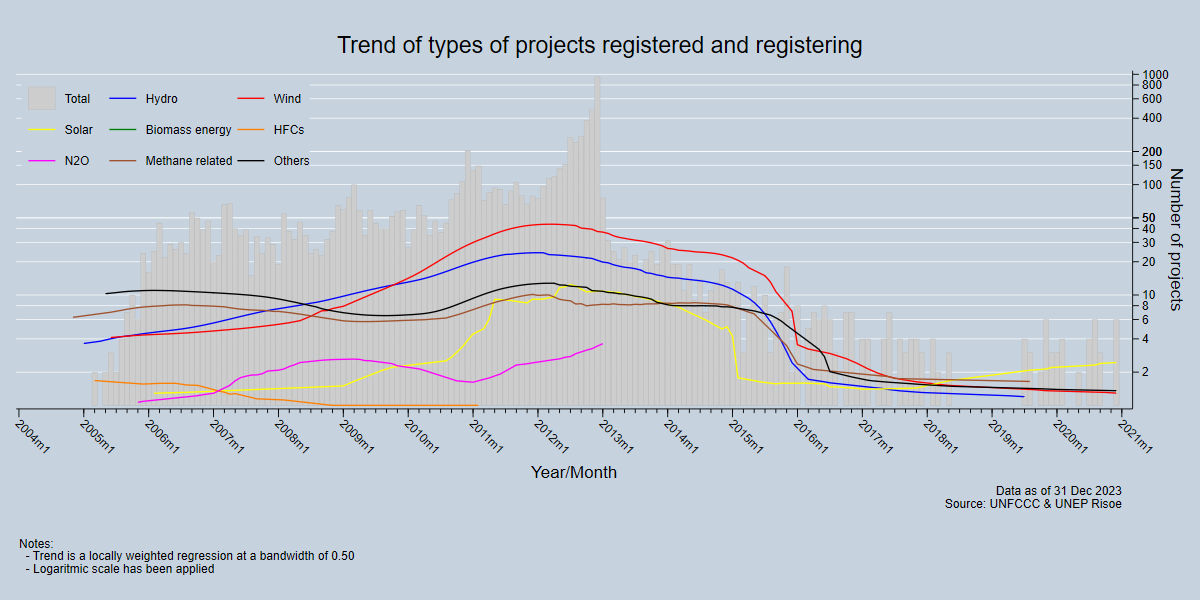
 Trend of types of projects registered and registering Trend of types of projects registered and registering |
Trend over time of types of projects (UNEP Risoe defined), which have the most registered and undergoing registration projects per month | Projects/month |  |
| [CDM-R3:Finalized Date / Registering Date] | ||||
|
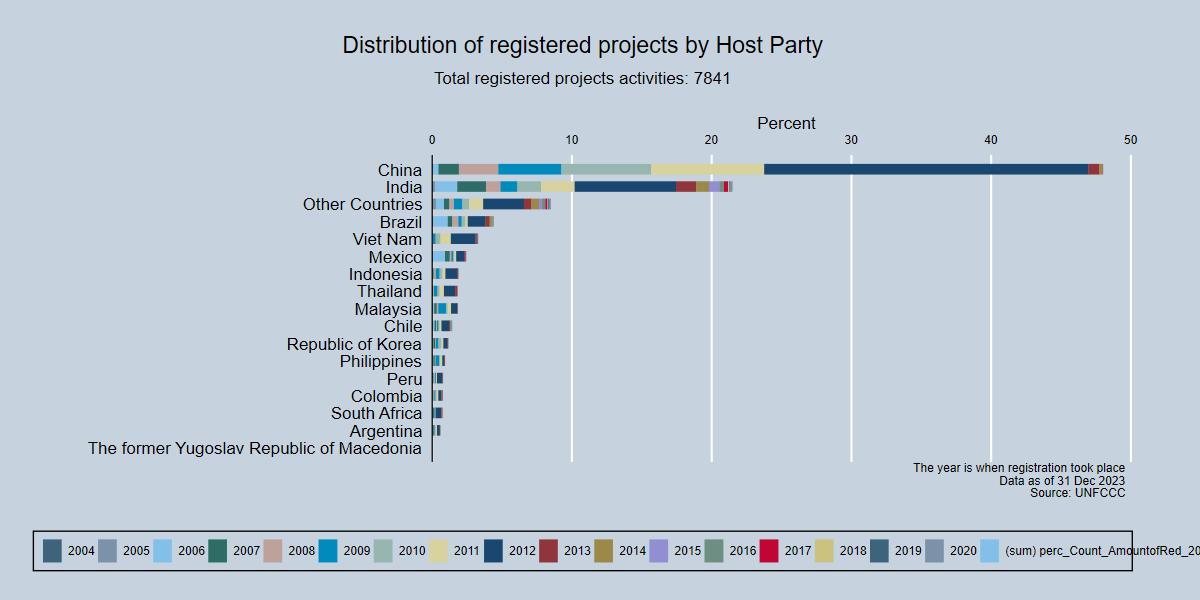
 Distribution of registered projects by Host Party Distribution of registered projects by Host Party |
Percentage of projects by Host Party of all registered projects | % Projects/Host Party |  |
| [CDM-R4:Finalized Date / Registering Date] | ||||

|
 Distribution of registered projects by Other Party Distribution of registered projects by Other Party |
Percentage of projects by Other Party of all registered projects | % Projects/Other Parties |  |
| [CDM-R5:Finalized Date / Registering Date] | ||||
|
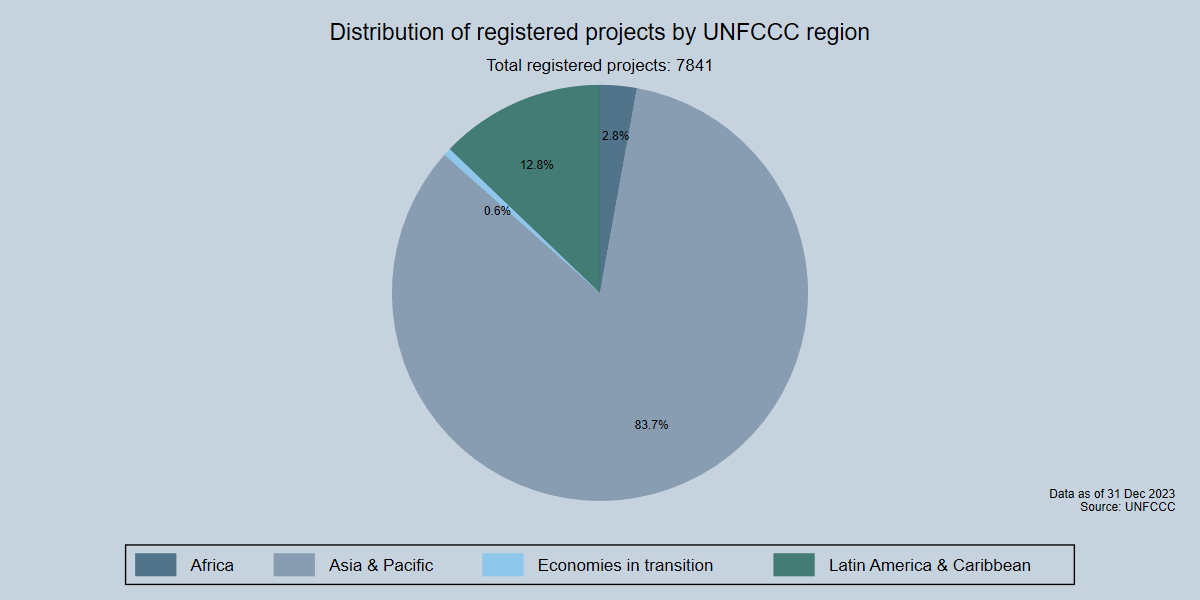
 Distribution of registered projects by UNFCCC region Distribution of registered projects by UNFCCC region |
Percentage of projects belonging to a UNFCCC defined region of all registered projects | % Projects/Region |  |
| [CDM-R6:Finalized Date / Registering Date] | ||||
|
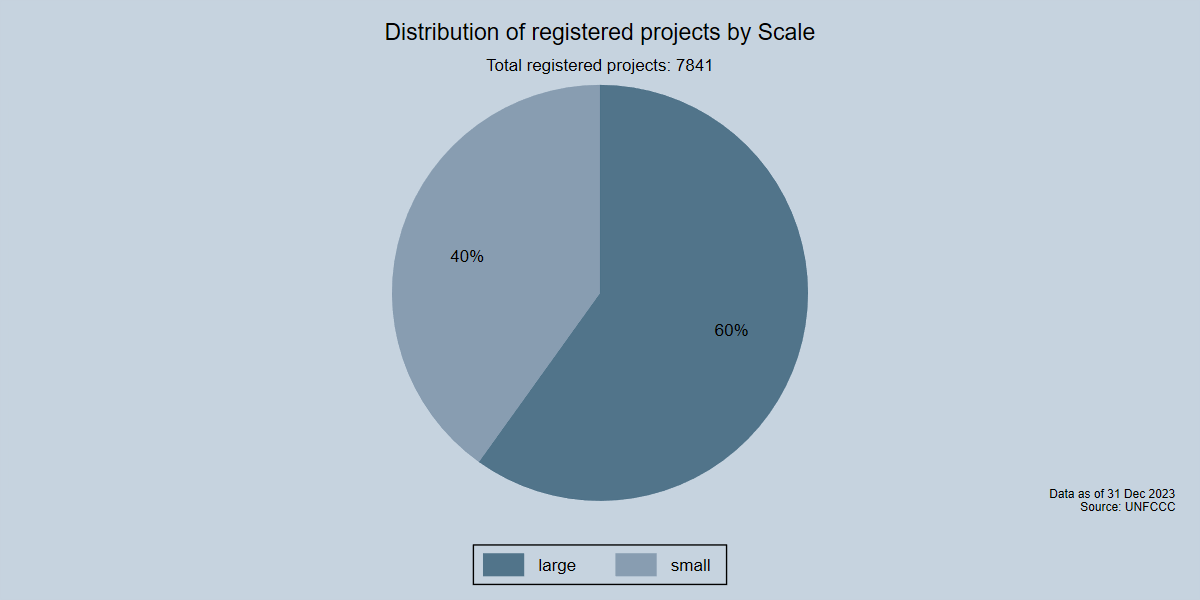
 Distribution of registered projects by Scale Distribution of registered projects by Scale |
Percentage of projects belonging to a CDM scale of all registered projects. | % Projects/Scale |  |
| [CDM-R7:Finalized Date / Registering Date] | ||||

|
 Distribution of registered projects by Scope Distribution of registered projects by Scope |
Percentage of projects belonging to a CDM scope of all registered projects | % Projects/Scope |  |
| [CDM-R8:Finalized Date / Registering Date] | ||||

|
 Distribution of registered projects by UN Region Distribution of registered projects by UN Region |
Percentage of project by UN Region / subregion of all registered projects | % Projects/Region |  |
| [CDM-R9:Finalized Date / Registering Date] | ||||

|
 Projects registering Projects registering |
Number of projects that have successfully started the registration per month, showing both large and small scale projects and overall trend. | % Projects/month |  |
| [CDM-R10:Finalized Date / Registering Date] | ||||

|
 Trend of projects registering by Host Party Trend of projects registering by Host Party |
Trend over time of projects in countries (Host Parties), which have started the most registration processes per month. | % Projects/month |  |
| [CDM-R11:Finalized Date / Registering Date] | ||||

|
 Trend of type projects starting registration process Trend of type projects starting registration process |
Trend over time of types of projects (UNEP Risoe defined), which have started the most registration processes per month | % Projects/month |  |
| [CDM-R12:Finalized Date / Registering Date] |
| Issuance | Title | Description | Unit | Data |
|---|---|---|---|---|
|
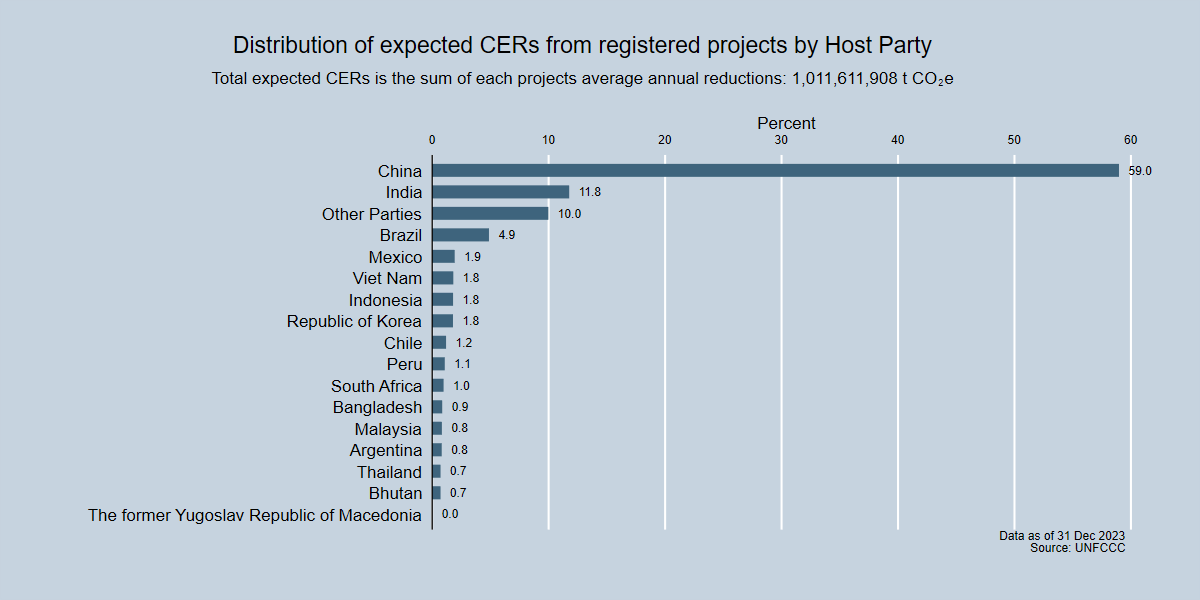
 Distribution of expected CERs from registered projects by Host Party Distribution of expected CERs from registered projects by Host Party |
Percentage (of the total) expected CERs from registered projects in a Host Party. Total CERs are based on each project`s average annual expected CERs | % CERs/Host Party |  |
| [CDM-I1:Issuance Date / Issuing Date] | ||||

|
 Distribution of CERs issued by Host Party Distribution of CERs issued by Host Party |
Percentage CERs issued from registered projects in a Host Party | % CERs/Host Party |  |
| [CDM-I2:Issuance Date / Issuing Date] | ||||
|
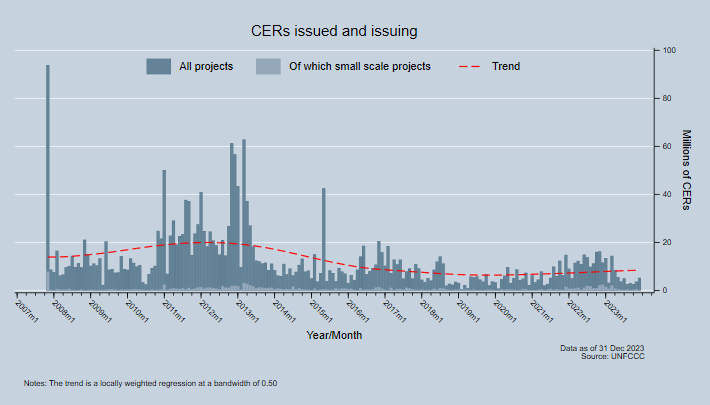
 CERs issued and issuing CERs issued and issuing |
Number of CERs issued and issuing per month, showing both large and small scale CERs and overall trend | Million CERs/month |  |
| [CDM-I2:Issuance Date / Issuing Date] | ||||
|
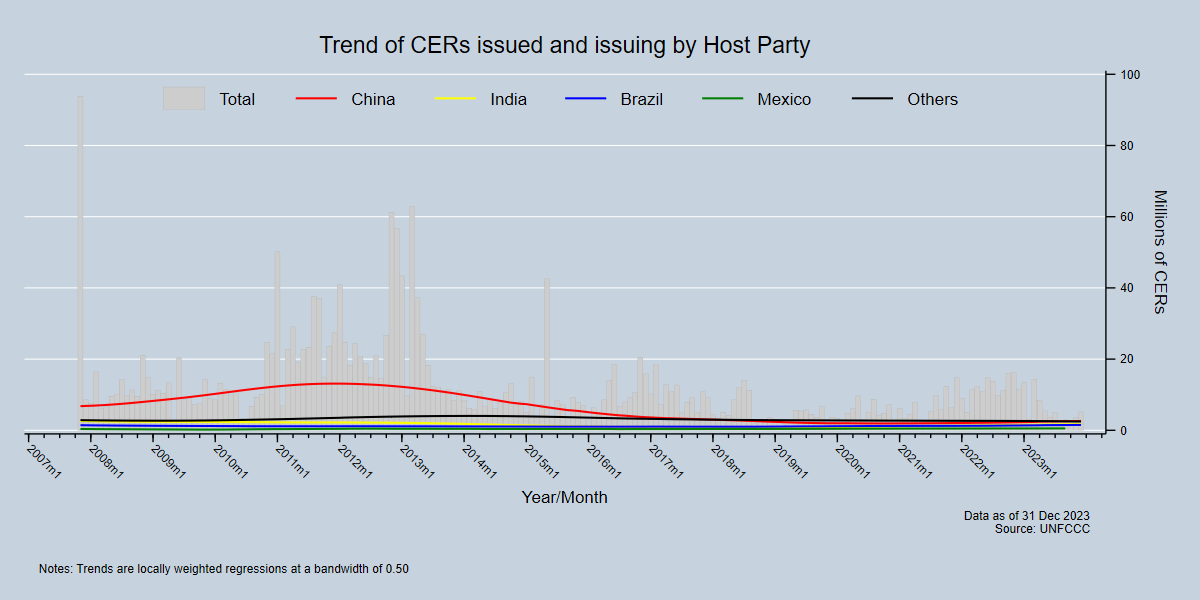
 Trend of CERs issued and issuing by Host Party Trend of CERs issued and issuing by Host Party |
Trend over time of CERs issued and issuing in countries (Host Parties), which have the most CERs per month | Million CERs/month |  |
| [CDM-I3:Issuance Date / Issuing Date] | ||||

|
 Trend of types of CERs issued and issuing Trend of types of CERs issued and issuing |
Trend over time of types (UNEP Risoe defined) of CERs issued and issuing, which have the most CERs per month | Million CERs/month |  |
| [CDM-I4:Issuance Date / Issuing Date] | ||||
|
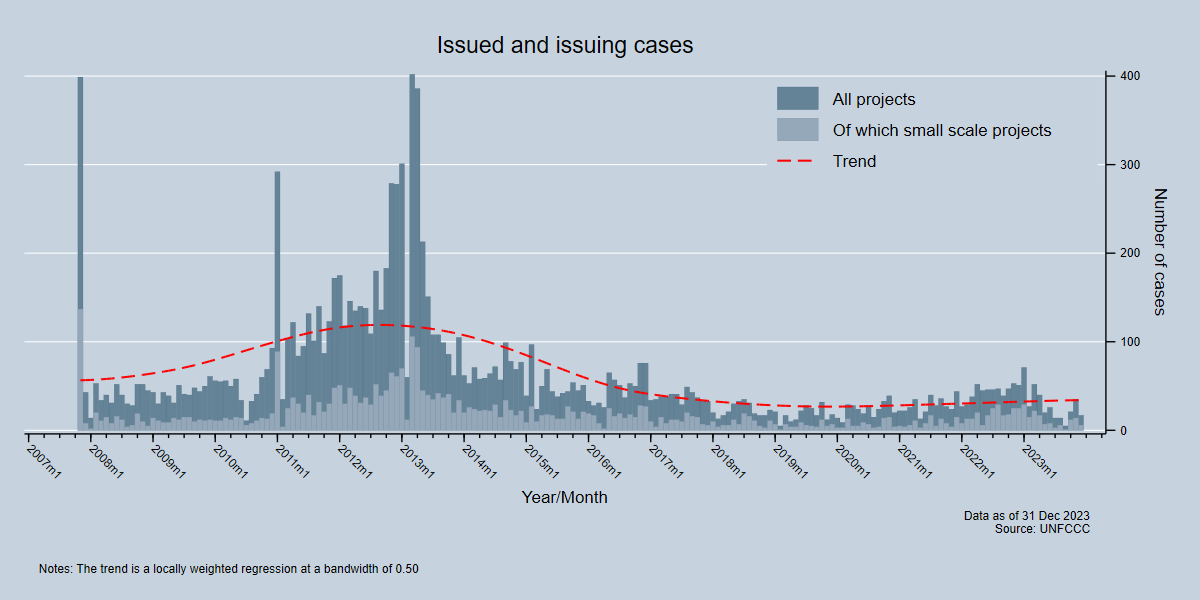
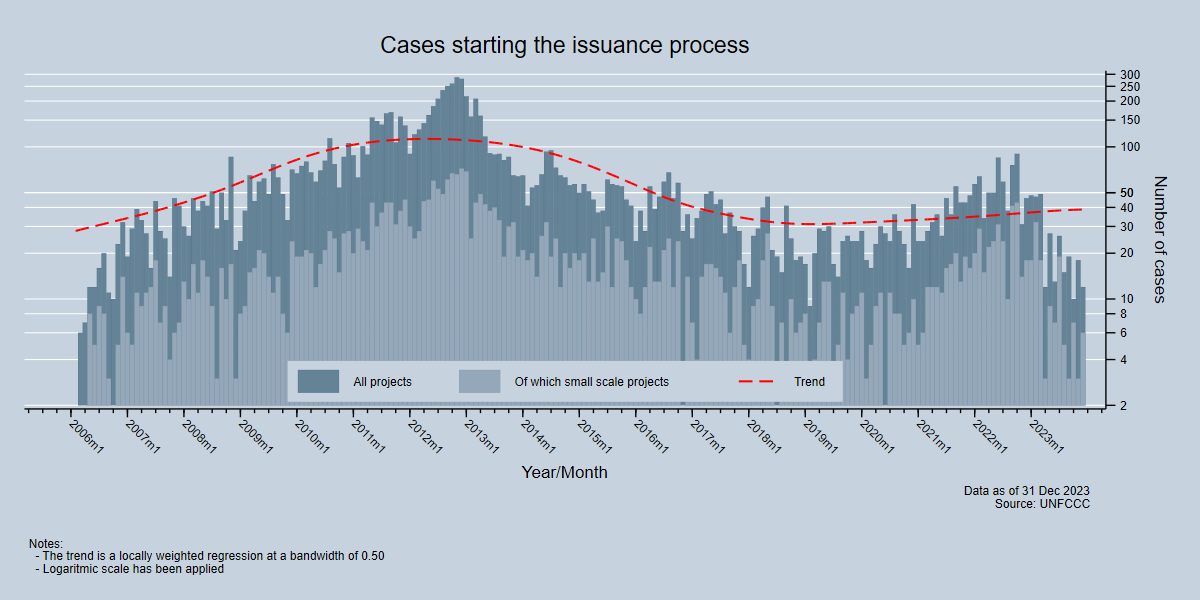
 Issued and issuing cases Issued and issuing cases |
Number of issuance and issuing request for issuance of CERs cases per month, showing both large and small scale CERs and overall trend | Cases/month |  |
| [CDM-I5:Issuance Date / Issuing Date] | ||||
|
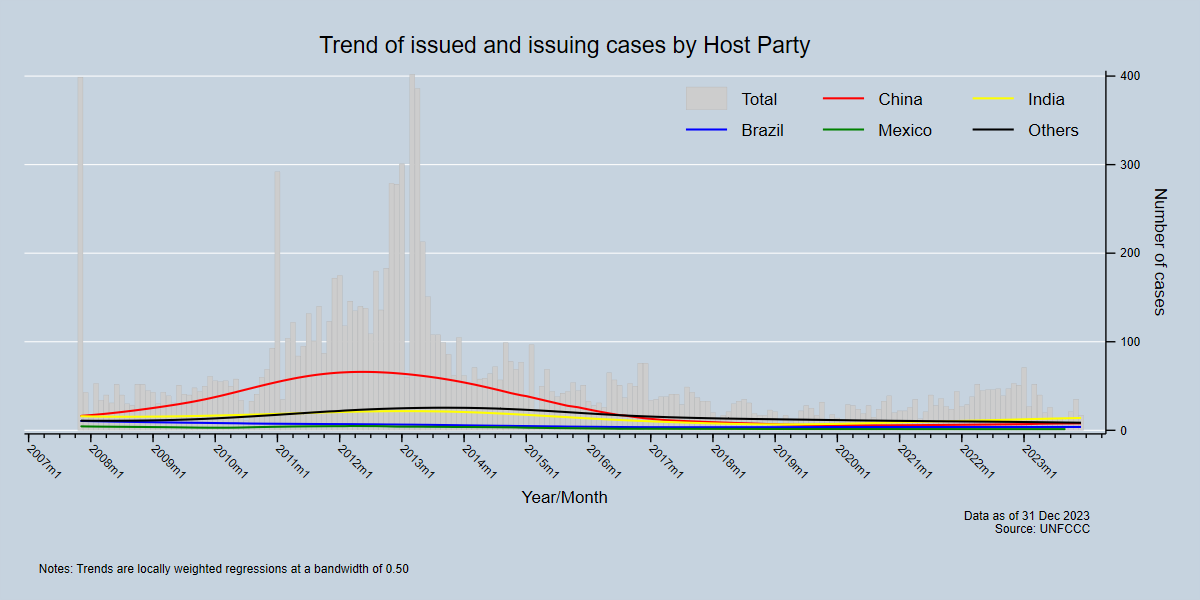
 Trend of issued and issuing cases by Host Party Trend of issued and issuing cases by Host Party |
Trend over time of cases issued and issuing in countries (Host Parties), which have the most CERs per month | Cases/month |  |
| [CDM-I6:Issuance Date / Issuing Date] | ||||
|
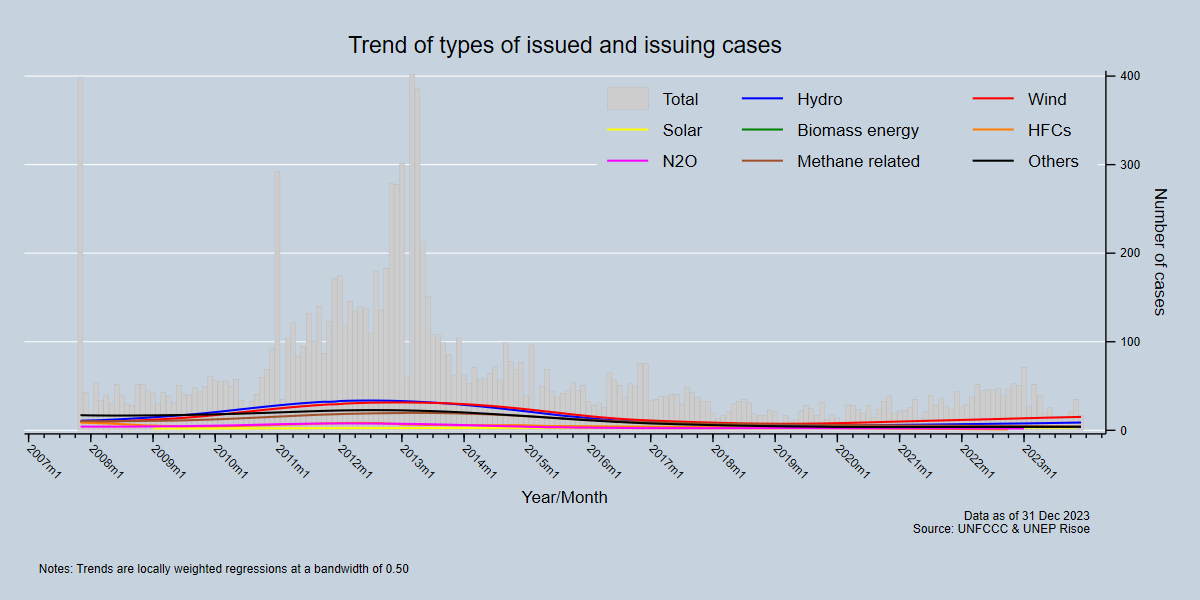
 Trend of types of issued and issuing cases Trend of types of issued and issuing cases |
Trend over time of types (UNEP Risoe defined) of issued and issuing cases, which have the most CERs per month | Cases/month |  |
| [CDM-I7:Issuance Date / Issuing Date] | ||||
|
 Trend of issuing cases Trend of issuing cases |
Trend of issuing cases, which have the most CERs per month | Cases/month |  |
| [CDM-I8:Issuance Date / Issuing Date] | ||||

|
 Trend issuing cases by Host Party Trend issuing cases by Host Party |
Trend over time of cases issuing in countries (Host Parties), which have the most CERs per month | Cases/month |  |
| [CDM-I9:Issuance Date / Issuing Date] | ||||
|
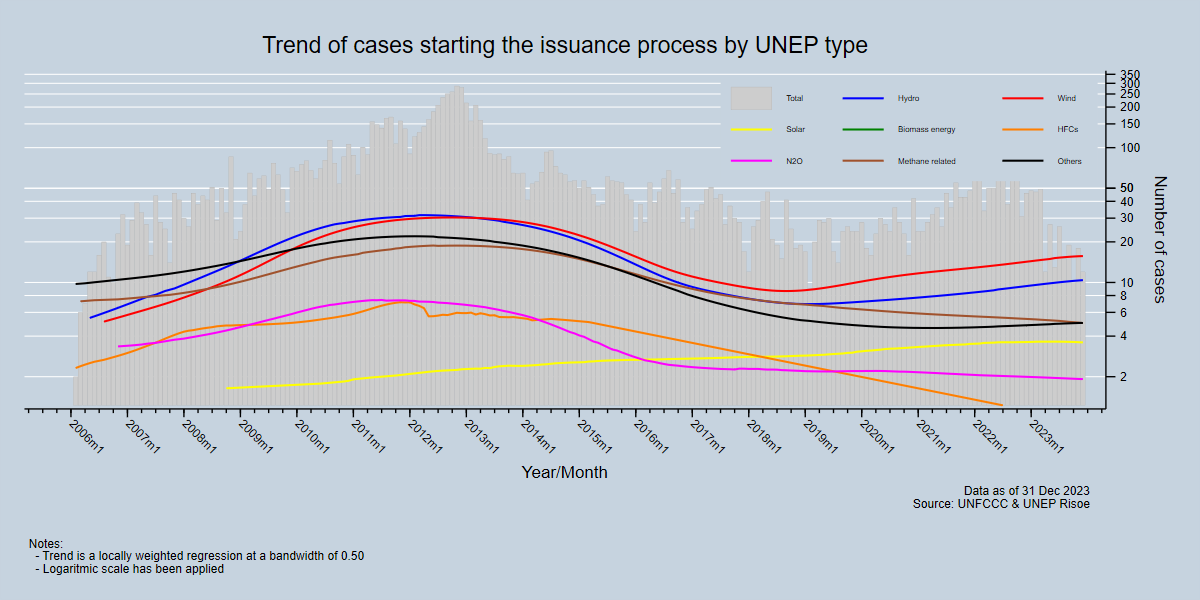
 Trend of types of issued and issuing cases Trend of types of issued and issuing cases |
Trend over time of types (UNEP Risoe defined) of issued and issuing cases, which have the most CERs per month | Cases/month |  |
| [CDM-I10:Issuance Date / Issuing Date] |
| First issuance | Title | Description | Unit | Data |
|---|---|---|---|---|
|
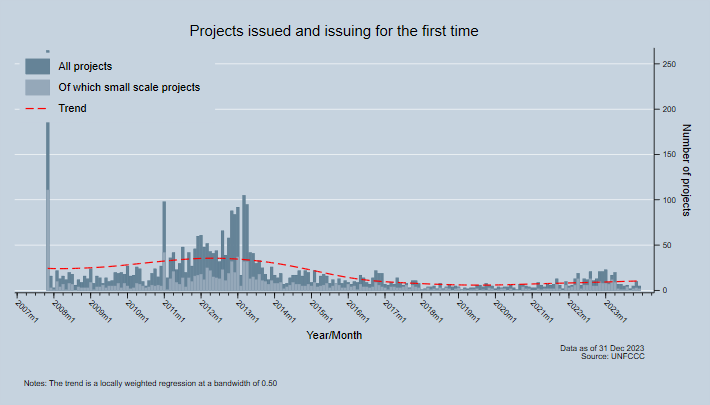
 Projects issued and issuing for the first time Projects issued and issuing for the first time |
Number of projects issued and issuing for the first time per month, showing both large and small scale projects and overall trend | Projects/month |  |
| [CDM-FI2:Issuance Date / Issuing Date] | ||||
|
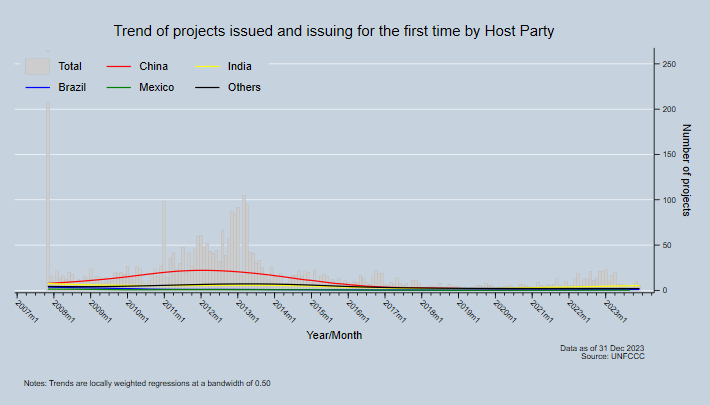
 Trend of projects issued and issuing for the first time by Host Party Trend of projects issued and issuing for the first time by Host Party |
Trend over time of projects issued and issuing for the first time in countries (Host Parties), which have the most CERs per month | Projects/month |  |
| [CDM-FI3:Issuance Date / Issuing Date] | ||||
|
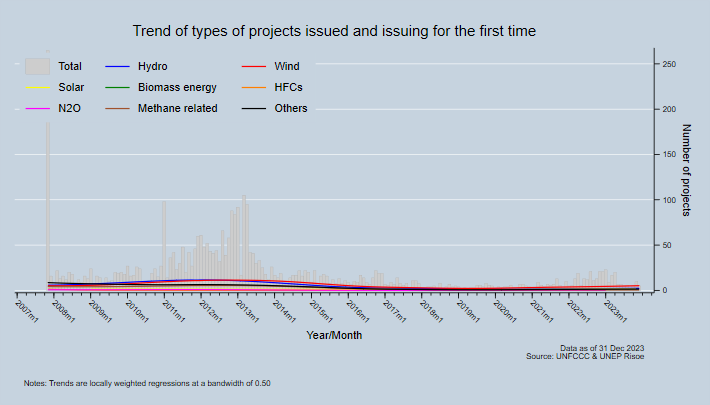
 Trend of types of projects issued and issuing for the first time Trend of types of projects issued and issuing for the first time |
Trend over time of types (UNEP Risoe defined) of projects issued and issuing for the first time, which have the most CERs per month | Projects/month |  |
| [CDM-FI4:Issuance Date / Issuing Date] | ||||

|
 Trend of CERs issued and issuing for the first time by Host Party Trend of CERs issued and issuing for the first time by Host Party |
Trend over time of CERs issued and issuing from projects issued and issuing for the first time in countries (Host Parties), which have the most CERs per month | Million CERs/month |  |
| [CDM-FI5:Issuance Date / Issuing Date] | ||||

|
 Trend of CERs issued and issuing for the first time by Host Party Trend of CERs issued and issuing for the first time by Host Party |
Number of projects issuing for the first time per month, showing both large and small scale projects and overall trend | Cases/month |  |
| [CDM-FI6:Issuance Date / Issuing Date] | ||||

|
 Trend of projects starting issuance process for the first time by Host Party Trend of projects starting issuance process for the first time by Host Party |
Trend over time of projects starting the issuance process for the first time in countries (Host Parties), which have the most CERs per month | Cases/month |  |
| [CDM-FI7:Issuance Date / Issuing Date] | ||||

|
 Trend of types of projects issued and issuing for the first time Trend of types of projects issued and issuing for the first time |
Trend over time of CERs issued and issuing from projects issued and issuing for the first time in countries (Host Parties), which have the most CERs per month | Cases/month |  |
| [CDM-FI8:Issuance Date / Issuing Date] |
| Methodologies | Title | Description | Unit | Data |
|---|---|---|---|---|
|
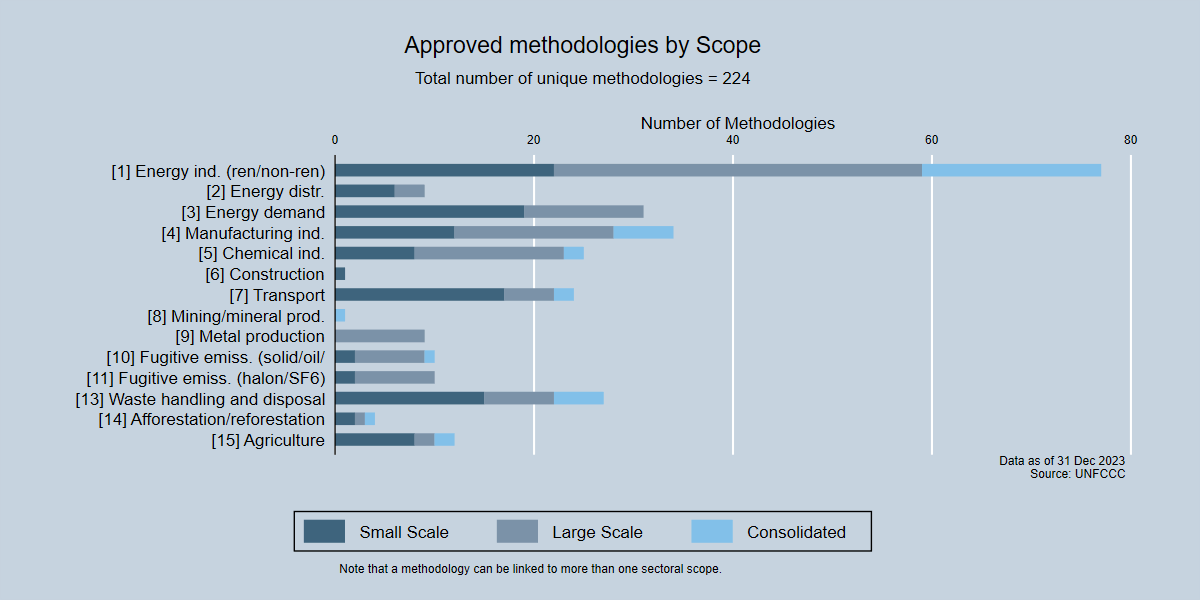
 Approved methodologies by Scope Approved methodologies by Scope |
Percentage of approved methodologies belonging to a CDM scope of all methodologies, showing both large, small scale and consolidated methodologies | Methodologies |  |
| [CDM-METH1:] |
| DNA | Title | Description | Unit | Data |
|---|---|---|---|---|
|
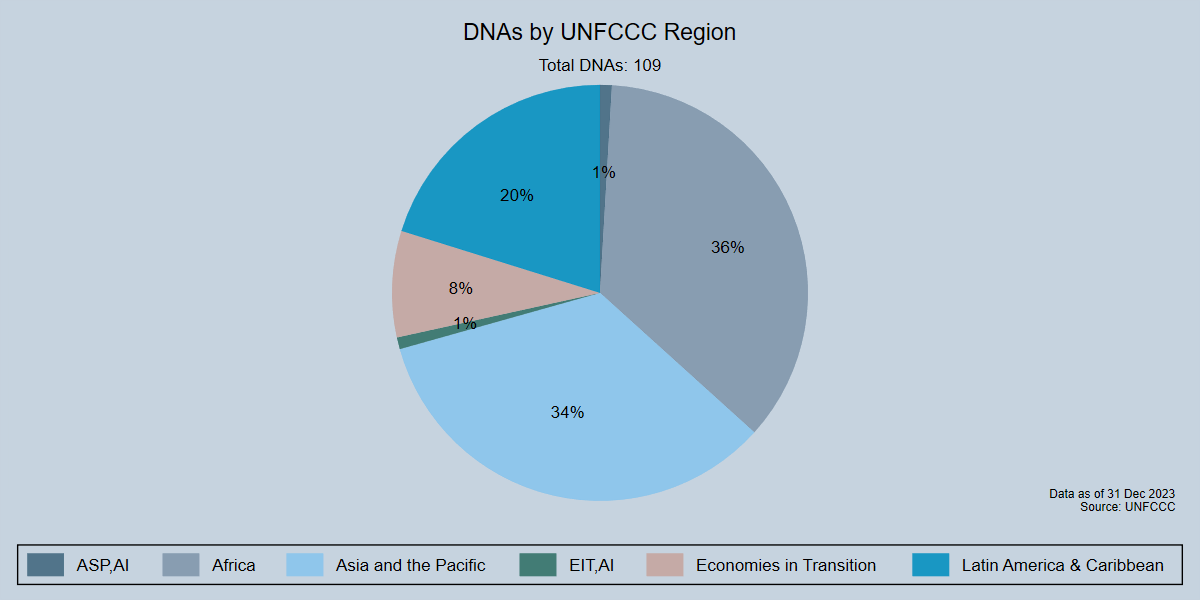
 Percentage of DNAs by UNFCCC region Percentage of DNAs by UNFCCC region |
Percentage of DNAs by UNFCCC region | DNAs |  |
| [CDM-DNA1:] | ||||
|
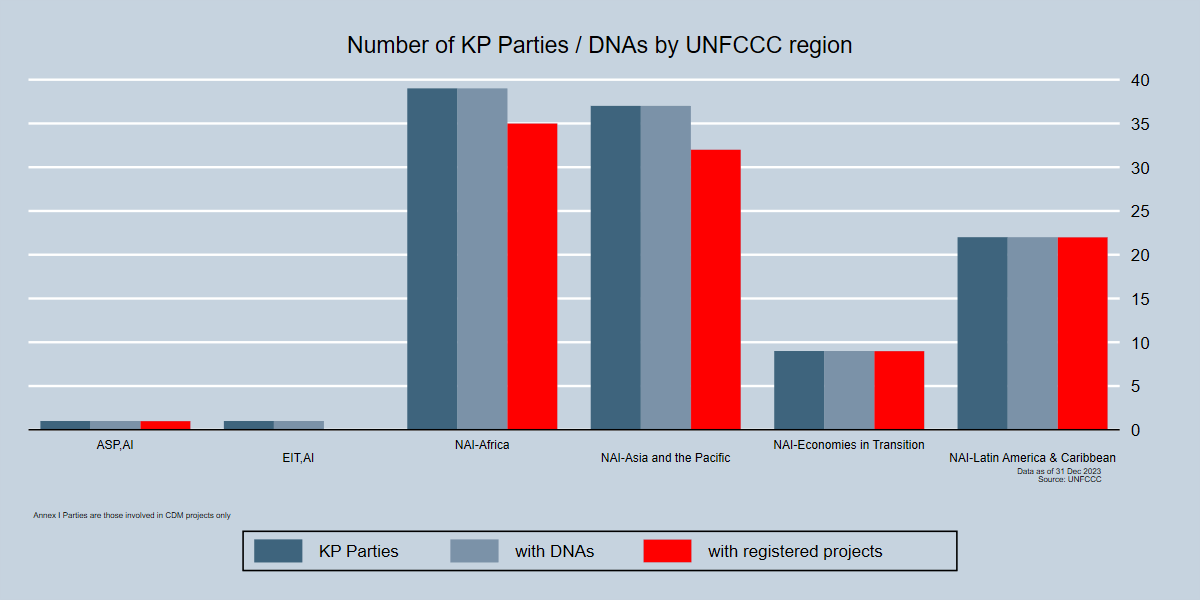
 Number of KP Parties and DNAs by UNFCCC region Number of KP Parties and DNAs by UNFCCC region |
Number of Parties that have ratified the Kyoto Protocol and number of Designated National Authorities by UNFCCC region, showing those Parties with registered projects | Parties andDNAs |  |
| [CDM-DNA2:] |
| Process time | Title | Description | Unit |
|---|---|---|---|
|
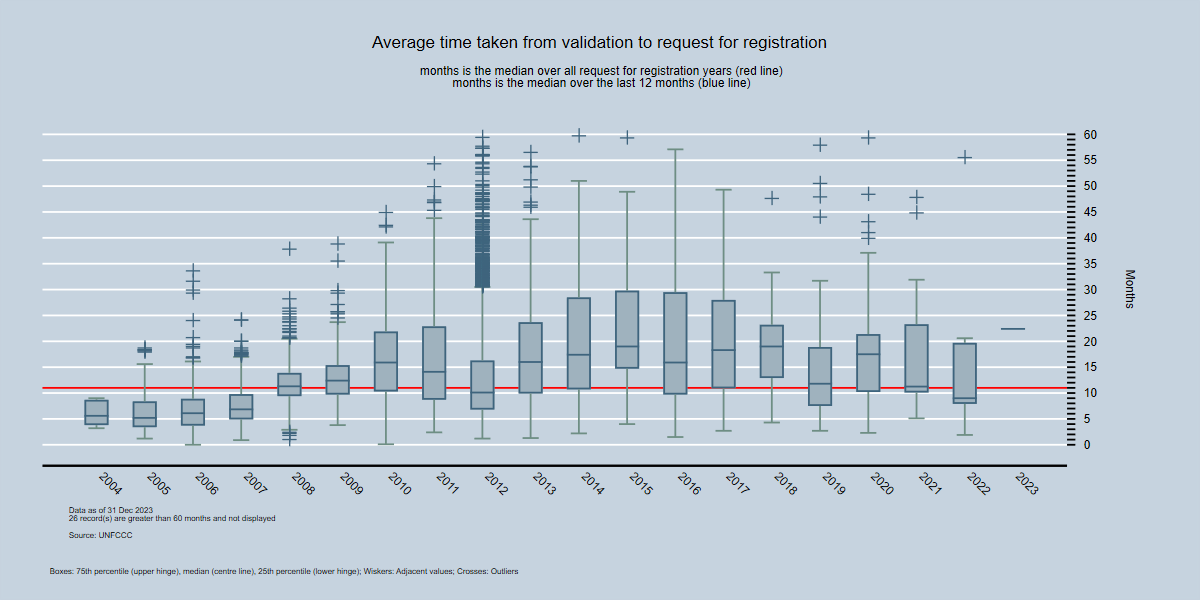
 Average time from validation to reg. request start - by year Average time from validation to reg. request start - by year |
For each year - The average time between the start of validation and start of the registration process | By Year - Average time |
| [CDM-PT1:OpenVal / SubmissionDate] | |||
|
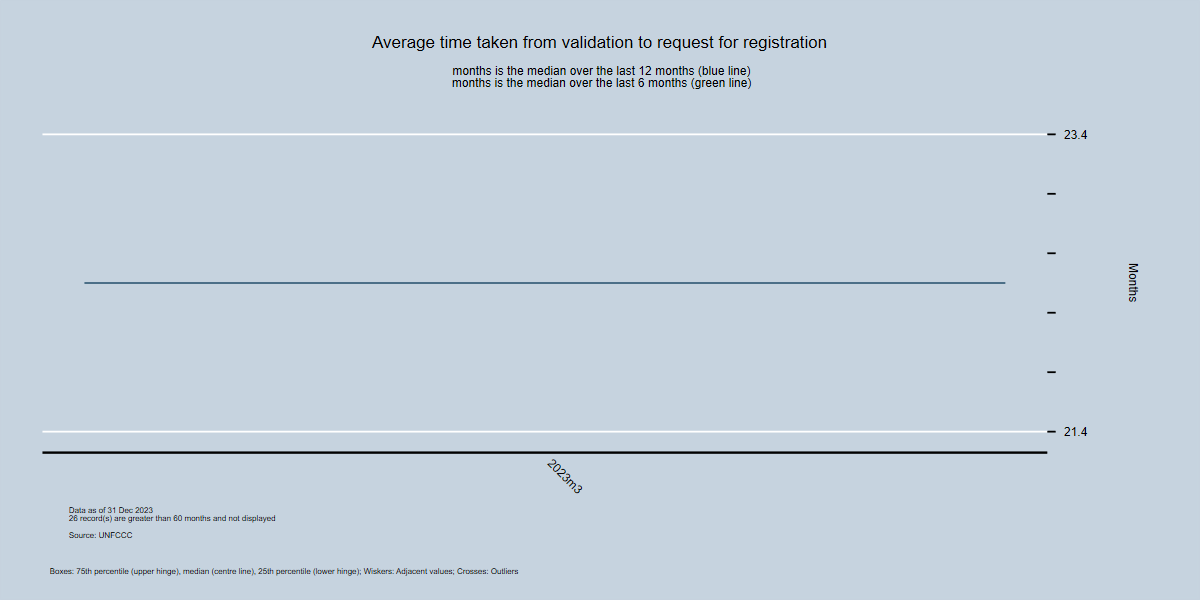
 Average time from validation to reg. request start - by month Average time from validation to reg. request start - by month |
For the last 12 months - The average time between the start of validation and the start of the registration request | By Month - Average time |
| [CDM-PT2:OpenVal / SubmissionDate] | |||

|
 Average time from start of reg. request to decision to register - by year Average time from start of reg. request to decision to register - by year |
For each year - The average time between the start of the registration process and the decision to register | By Year - Average time |
| [CDM-PT3:SubmissionDate / EBDecisionDate] | |||

|
 Average time from start of reg. request to decision to register - by month Average time from start of reg. request to decision to register - by month |
For the last 12 months - The average time between the start of the registration process and the decision to register | By Month - Average time |
| [CDM-PT4:SubmissionDate / EBDecisionDate] | |||
|
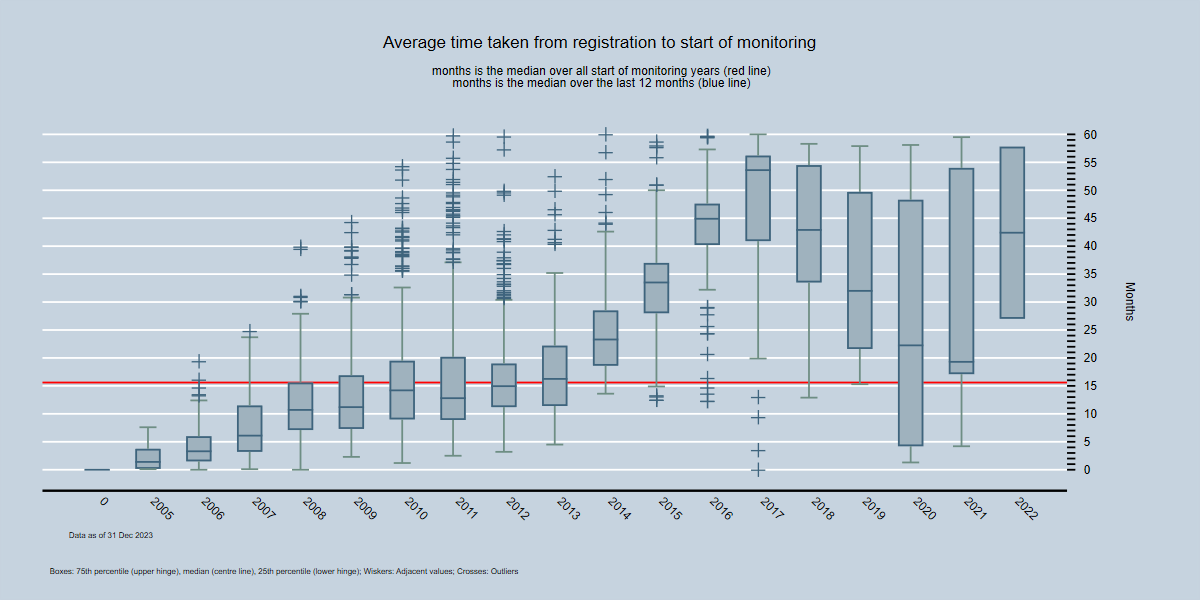
 Average time from registration to first MR - by year Average time from registration to first MR - by year |
For each year - The average time between registration and first monitoring report of a project | By Year - Average time |
| [CDM-PT5:EBDecisionDate / MonitoringStartDate] | |||
|
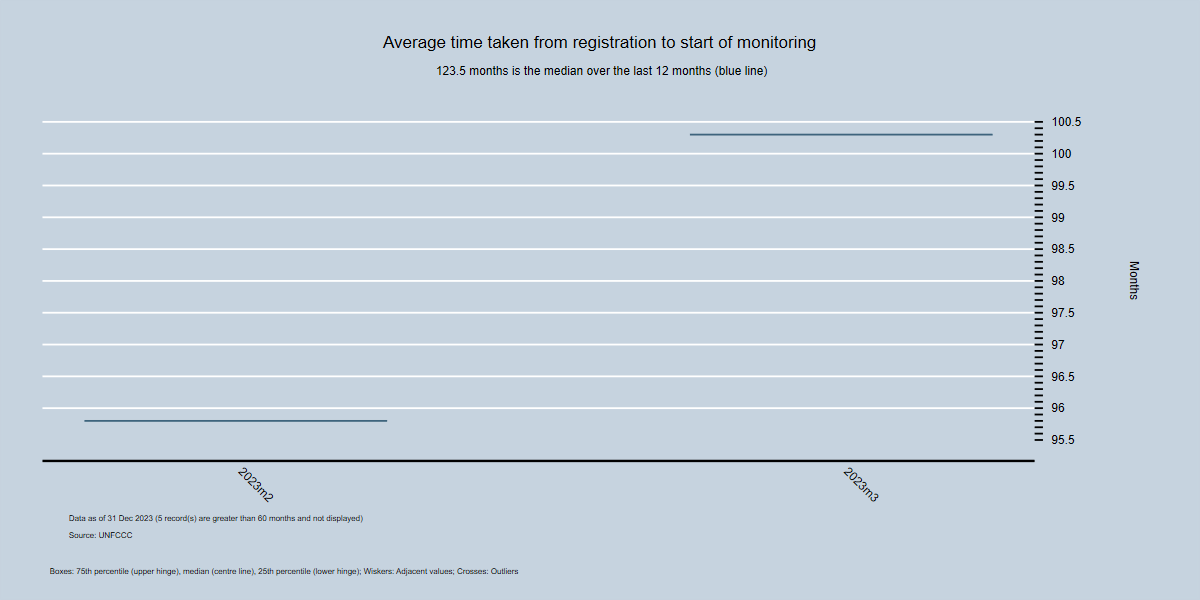
 Average time from registration to first MR - by month Average time from registration to first MR - by month |
For the last 12 months - The average time between registration and first monitoring report of a project | By Month - Average time |
| [CDM-PT6:EBDecisionDate / MonitoringStartDate] | |||
|
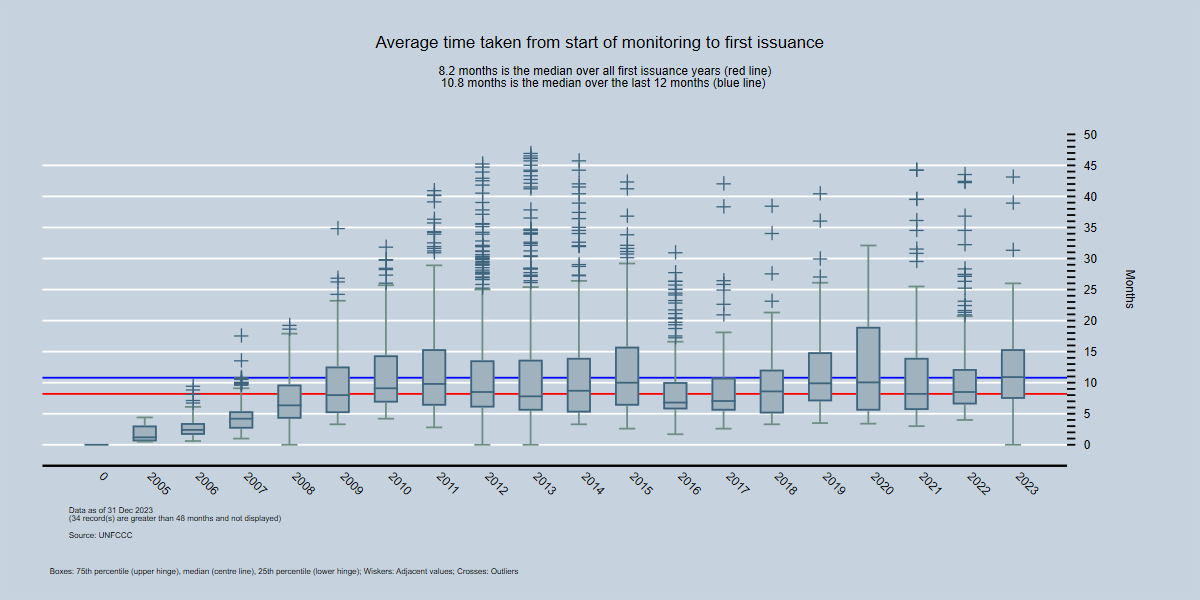
 Average time from first MR to first IR - by year Average time from first MR to first IR - by year |
By Year - Average time between first monitoring report and first issuance request | By Year - Average time |
| [CDM-PT7:MonitoringStartDate / IssuanceRequestDate] | |||
|
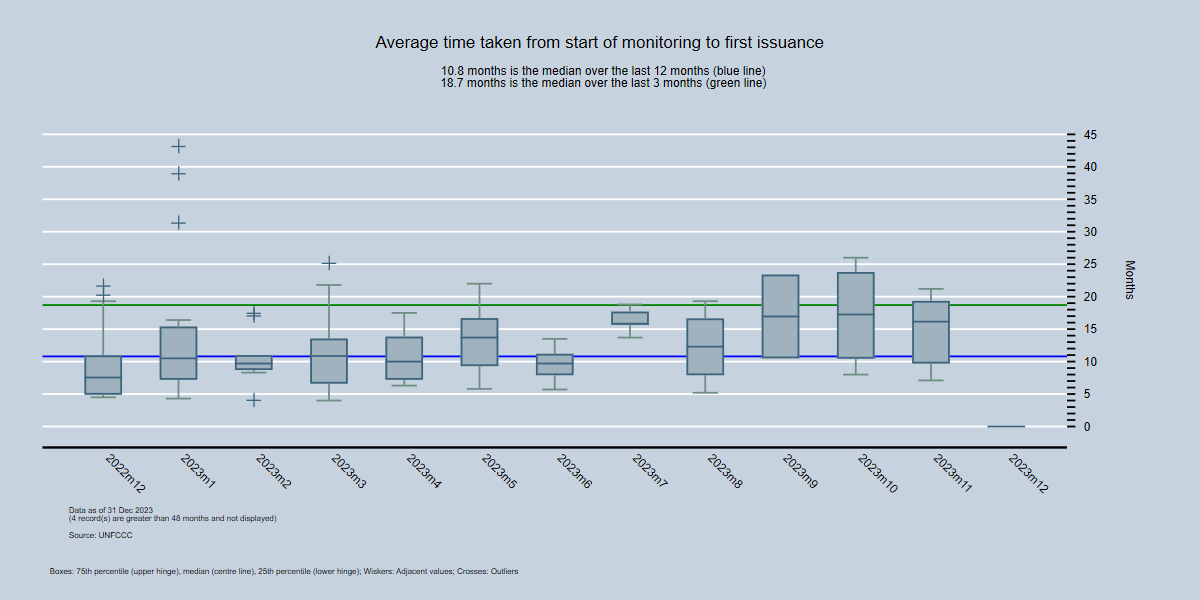
 Average time from first MR to first IR - by month Average time from first MR to first IR - by month |
For the last 12 months - Average time between first monitoring report and first issuance request | By Month - Average time |
| [CDM-PT8:MonitoringStartDate / IssuanceRequestDate] | |||
| LDC Registration/Issuances | Title | Description | Unit | Data |
|---|---|---|---|---|
|
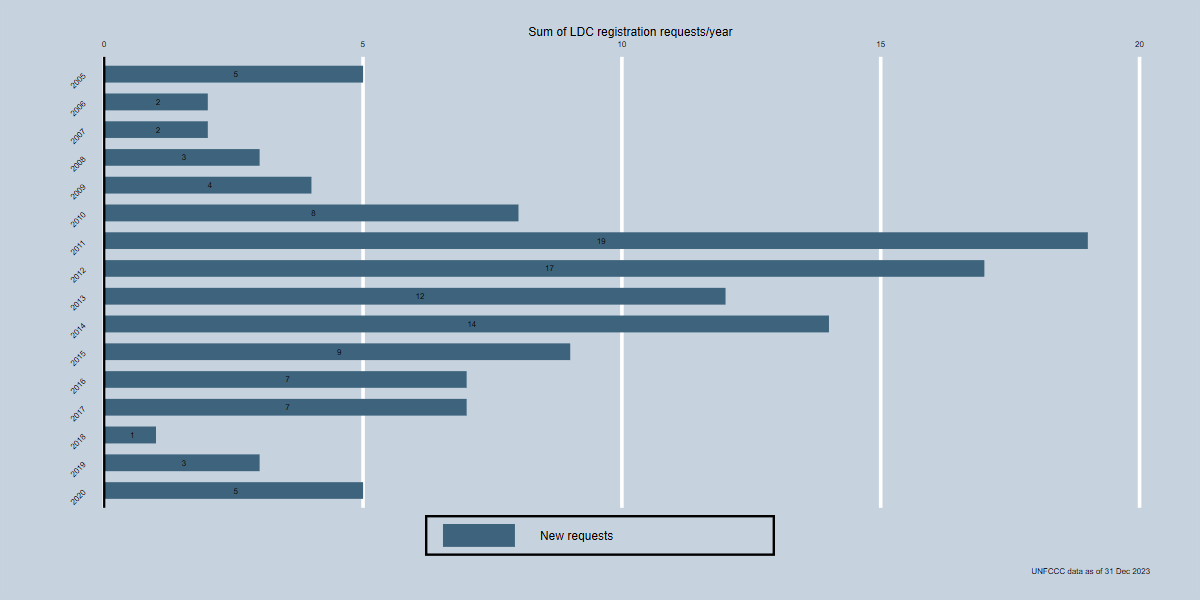
 LDC Registration Requests by Year LDC Registration Requests by Year  LDC Registration Requests by Month(current year) LDC Registration Requests by Month(current year) |
Number of registration requests by year (or for current year by month) that have been submitted by Host Parties classed as a Least Developed Country | LDC Reg Request/Year (LDC Reg Request/Month) |  |
| [CDM-LDC1:FinalizedDate / PublicDate / SubmissionDate] | ||||
|
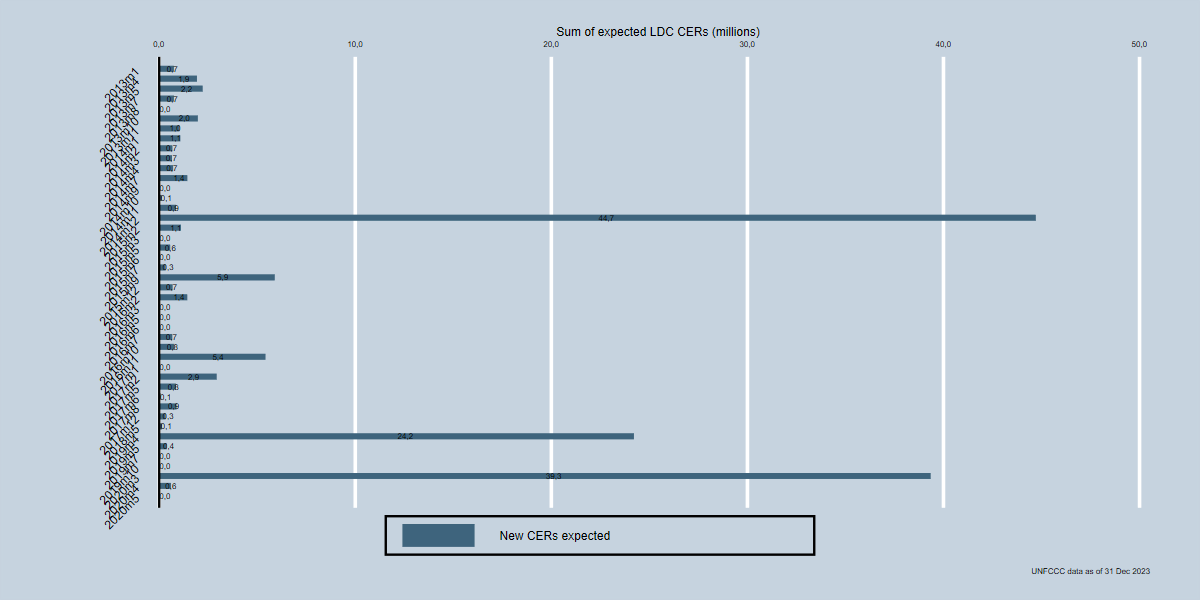
 Total expected CERs for LDC Registration Requests by month Total expected CERs for LDC Registration Requests by month |
Total number of expected CERs (Annual Emission reductions multipled by crediting period) for LDC registration requests by month (for the current year) | LDC Reg Request/Month |  |
| [CDM-LDC2:FinalizedDate / PublicDate / SubmissionDate] | ||||

|
 LDC Issuance Requests by year LDC Issuance Requests by year  LDC Issuance Requests by month LDC Issuance Requests by month |
Number of issuance requests by year (or for current year by month) that have been submitted by Host Parties classed as a Least Developed Country | LDC Issuance Request/Year (LDC Issuance Request/Month) |  |
| [CDM-LDC3:IssuanceRequestDate] | ||||

|
 Total expected CERs for LDC Issuance Requests by month Total expected CERs for LDC Issuance Requests by month |
Total number of expected CERs (Annual Emission reductions multipled by crediting period) for LDC issuance requests by month (for the current year) | Expected CERs for Issuance Request/Month |  |
| [CDM-LDC4:IssuanceRequestDate] |
Total potential supply of CERs
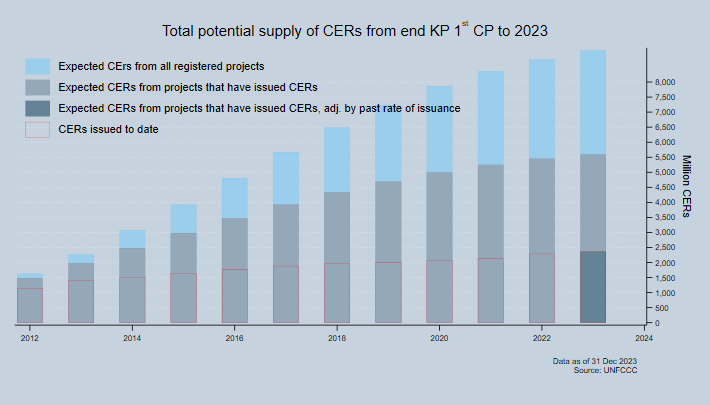
 Total potential supply of CERs from the end of the 1st Kyoto Protocol commitment period (31 Dec. 2012) to 2020.
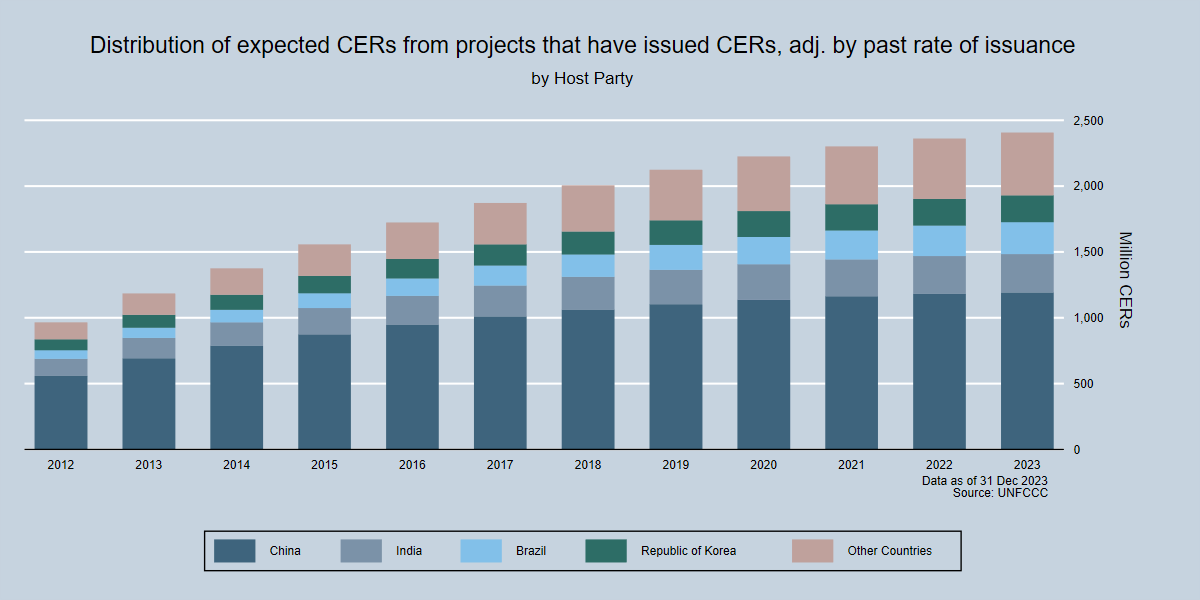
 Total potential supply of CERs by host party from the end of the 1st Kyoto Protocol commitment period (31 Dec. 2012) to 2020.
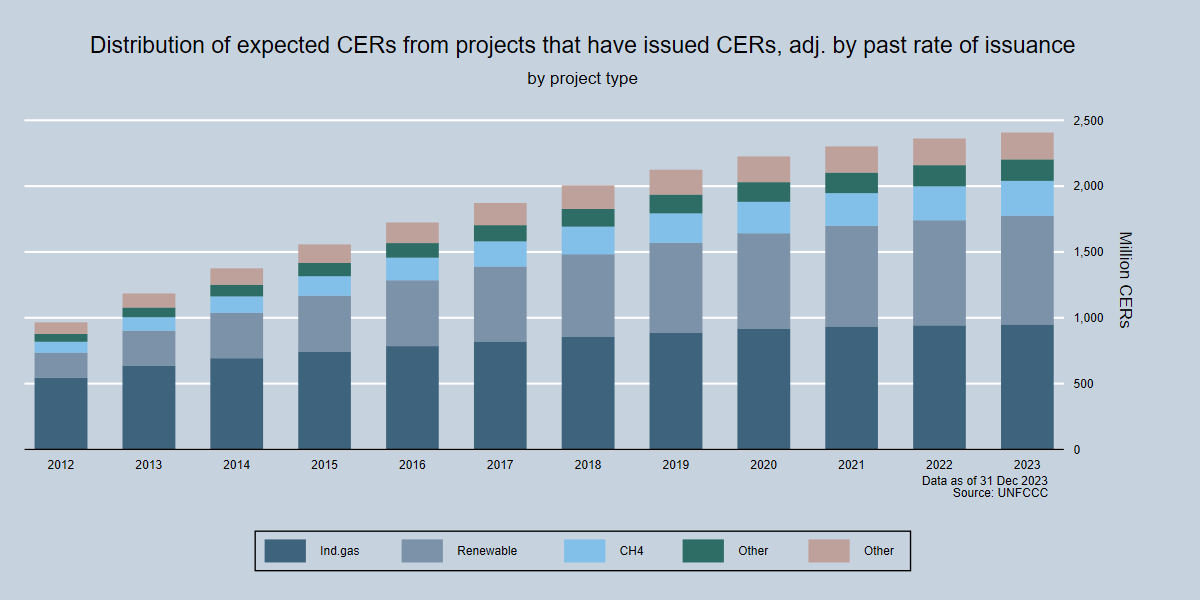
 Total potential supply of CERs by project type from the end of the 1st Kyoto Protocol commitment period (31 Dec. 2012) to 2020.
Map of KP Parties and DNAs
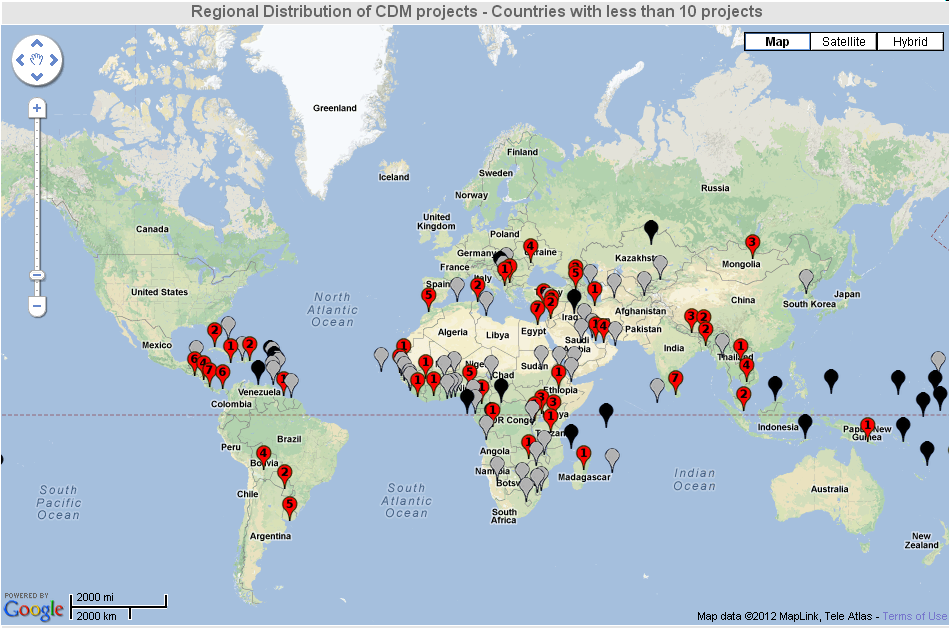
A geographic representation of Parties that have ratified the Kyoto Protocol and Designated National Authorities, showing those Host Parties that have less than 10 registered projects
Academics and Researchers
The UNFCCC secretariat collates time bound data on various aspects of the CDM, subject to availability. Universities and research institutes that need access to additional data for research purposes can send an email request to cdm-info@unfccc.int clearly stating the intended use of the data in a short research brief.


Offset now: visit the United Nations Carbon Offset Platform
Connect with us: